In the digital world, understanding what your users and potential customers are doing is important to improve business. Google Analytics 4 (GA4) is a great tool to collect this data. However, sometimes errors can occur during data collection—this is where debugging comes into play.
This guide is for anyone who wants to find and fix bugs in GA4. In this article, we’ll explain how to debug in GA4.
GA4 DebugView
GA4 DebugView is a great tool to debug your GA4 data and activities. To access this tool, go to Admin → DebugView page after logging into your GA4 property.
Although GA4 DebugView is often confused with Google Tag Manager (GTM) Debug (Preview mode), they’re actually two different things. We’ll talk about GTM Preview mode later in our insights. If you don’t want to miss it, don’t forget to sign up for our email list and follow our articles.
You may see a blank page when you view the DebugView page because there is no data to debug here yet. To see the data in DebugView, you must first specify that you want to debug the incoming data to GA4.
Let’s talk about a few simple ways to do this.
How to enable GA4 DebugView
Following one of the three ways mentioned below, you’ll have told GA4 that you want to debug incoming data. So you can start to see some data in the DebugView page.
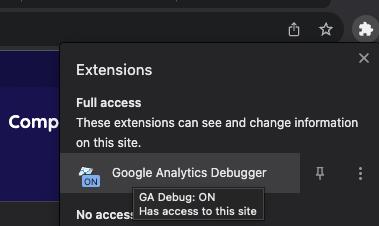
Use Google Analytics Debugger Chrome Plugin
If the browser you’ll use while debugging is Google Chrome, it’s possible to perform the activities on your website in debug mode using this plugin.
Visit the page and click the “Add to Chrome” button. The add-on will be downloaded and added to your browser shortly. After the plugin is installed, it’ll be added to the plugins section of your browser. Here, you can activate the plugin by clicking on it. When you visit your website while the plugin is active, all actions will occur in debug mode and appear on the GA4 DebugView page.
Visit the page with Google Tag Manager Preview Mode
Visiting your website using Google Tag Manager preview mode will enable debug mode. Therefore, you can see the events on the DebugView page. We explain the details about Google Tag Manager debug mode in this article.
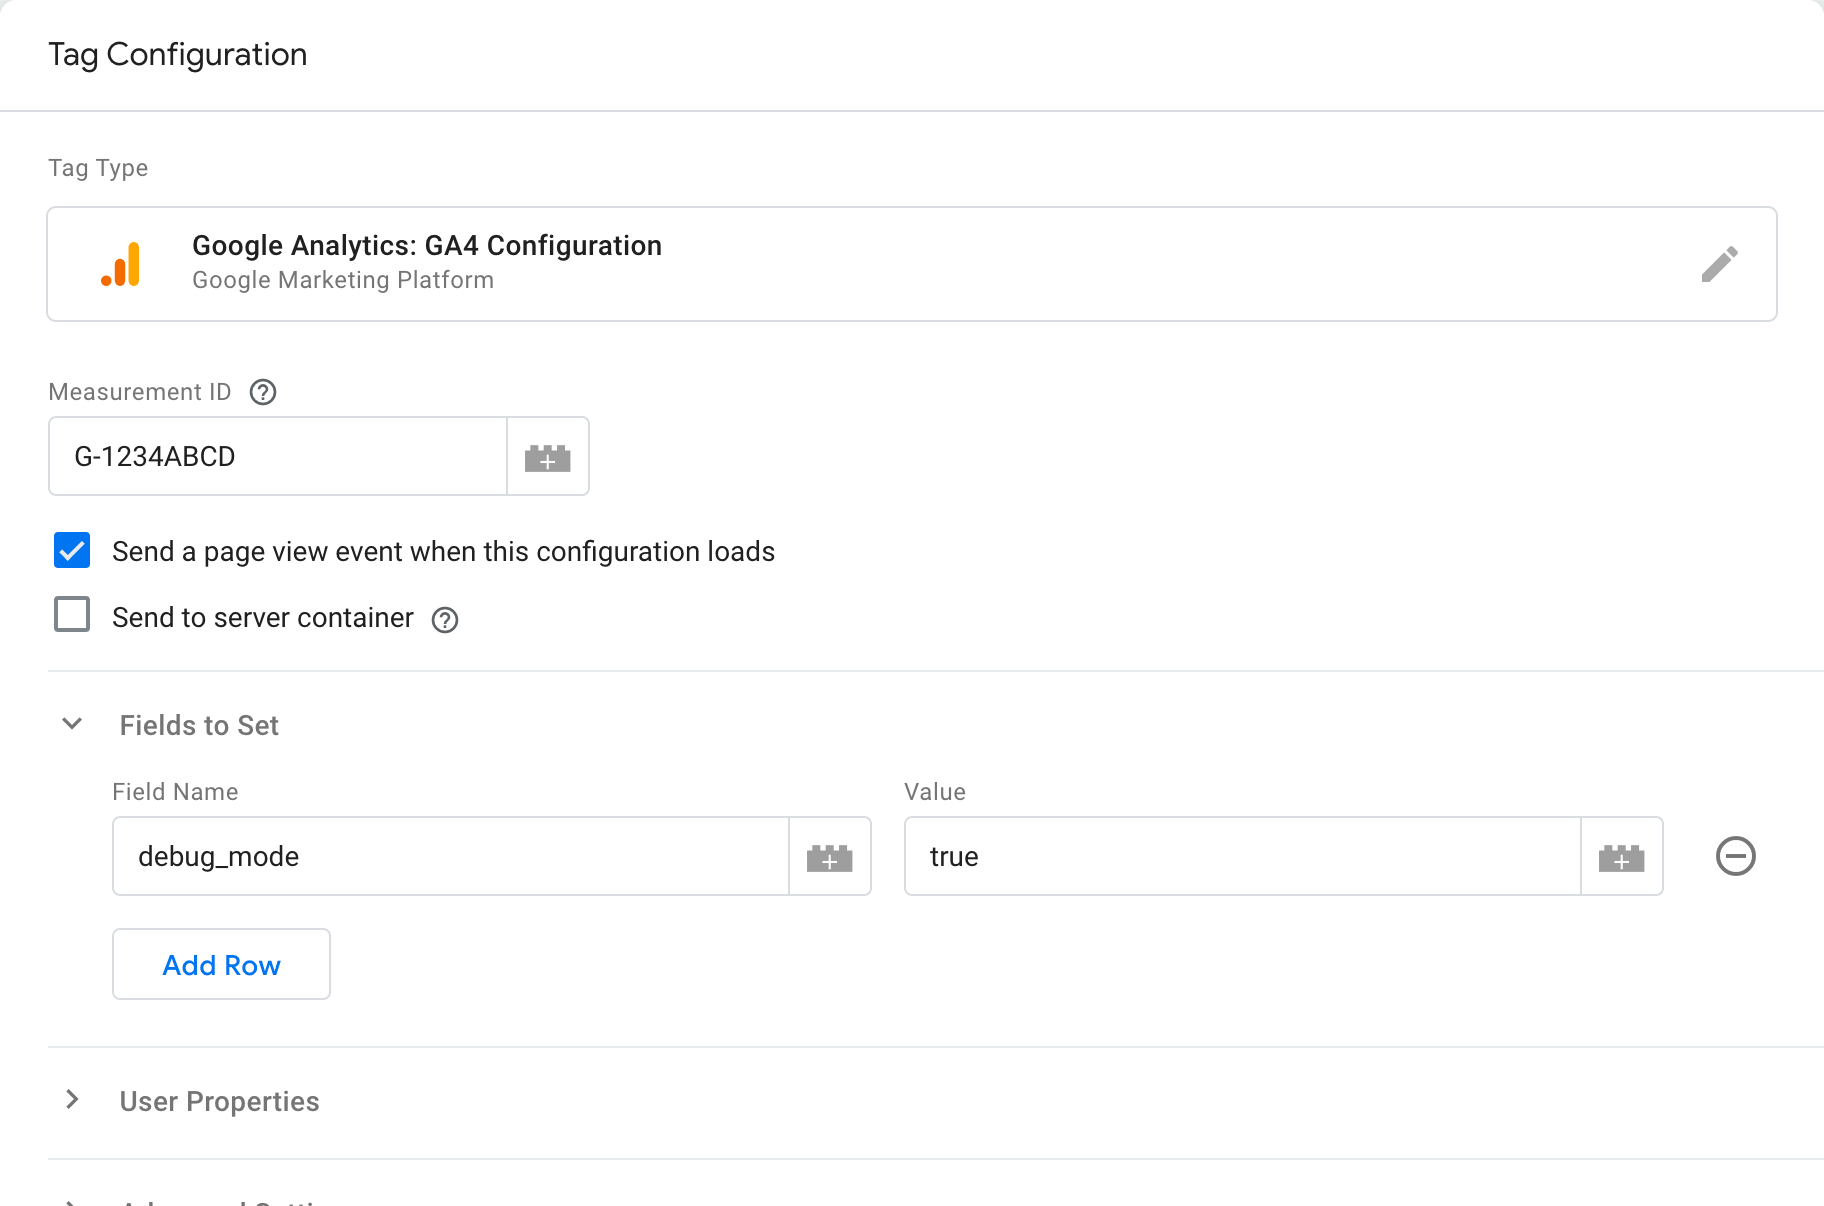
Use the debug_mode parameter when sending an event
Passing the debug_mode parameter to “true” for an event ensures that the event is included in the DebugView data. You can do this for any event you want or all your events using a simple GTM setting. Add the “debug_mode” parameter to your Google Analytics: GA4 configuration tag in GTM to debug all website users’ activities.
And now you’re ready. When you do one of the above operations, you’ll start to see your data on the DebugView page. Now, let’s take a look at the DebugView page.
Overview of DebugView Page
Although the DebugView page may seem complicated at first glance, it’s actually designed to be extremely simple and understandable. Let’s make your debugging easier by talking about what some important parts mean.
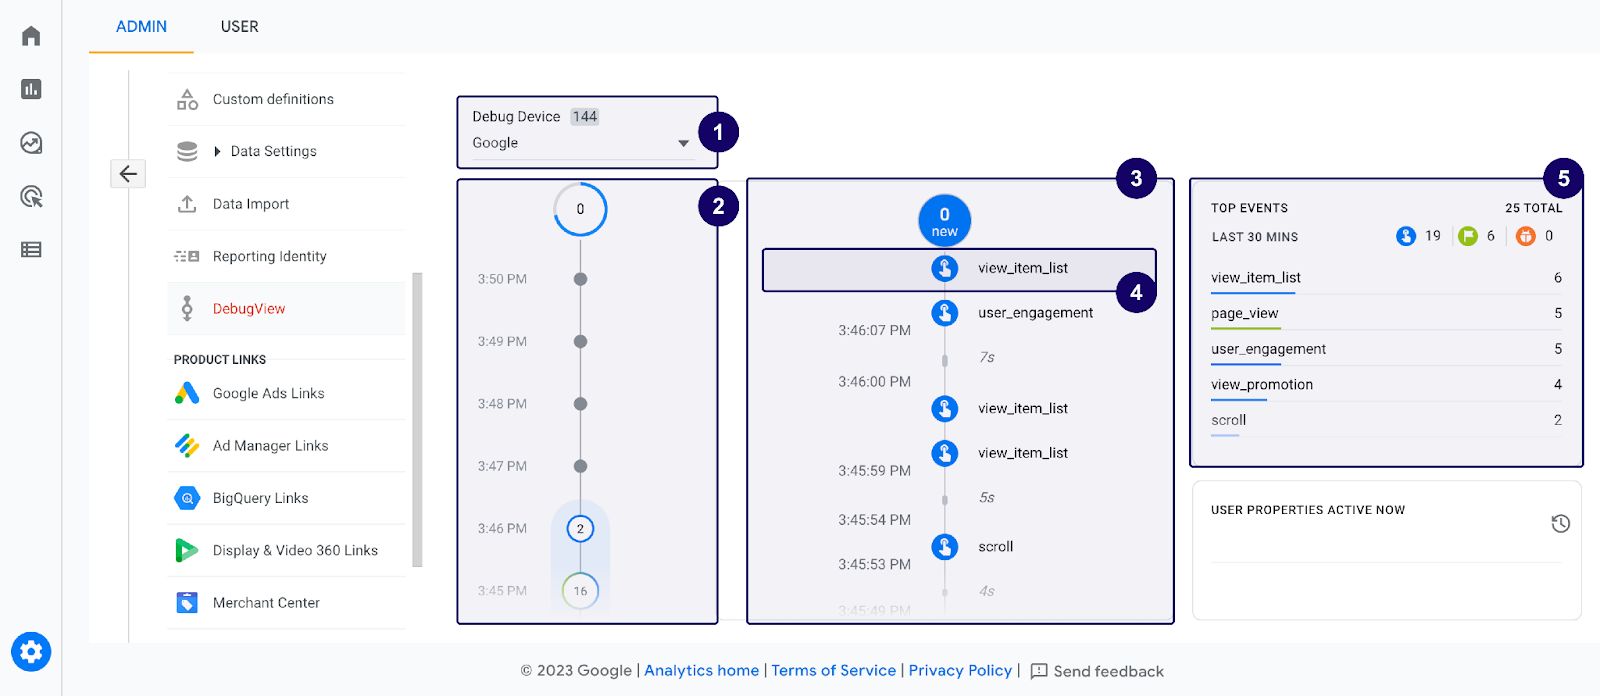
1. Debug Devices
In this section, you can see different devices with debug mode on and switch between these devices. This lets multiple developers focus on their instrumentation and validation efforts without impacting one another.
2. Minutes Stream
In the “Minutes Stream” section, you can see the data from DebugView grouped by minutes. It shows 30 circles, each circle of the last 30 minutes, and the number in these circles shows the events that took place during that minute. Clicking on any of these circles populates the “Seconds Stream” with data for that minute.
3. Seconds Stream
In this area, the events that took place within the minute you selected from the “Minutes Stream” field are displayed. If there’s no selection, you’ll see a list of events from the last 60 seconds by default. You can view each event’s occurrence timestamp, name, and time elapsed between events from this area. As debug events continue to be recorded, the stream is automatically refreshed, with the newest events at the top.
4. Event
This section shows the event name that took place and the exact time it happened. You can click on it to get details about the event and see all the parameters of that event.
5. Top Events Table
The “Top Events table” lists essential events over the last 30 minutes and summarizes their information.
Filter out developer traffic
It’s important to filter the traffic when Debug mode is turned on so that the developers’ data won’t impact the data you collect. In this way, the events you perform for debugging don’t interfere with the events of your website visitors. While this is optional for debugging GA4, we strongly recommend it to avoid confusion in your reports. To do this, you can follow these steps:
- Login to your Google Analytics property and click the Admin button.
- Find the “Property” column and click “Data Settings” > “Data Filters”.
- Click “Create Filter”.
- Click on “Developer Traffic”.
- Specify a name for the data filter you will create.
- Check the “Exclude” option.
- Select the “Testing” option.
- Save your filter by clicking the “Create” button.
Google Analytics will filter out any data collected from users when debug mode is enabled. It’ll allow you to test your property without disrupting the data in your reports.
Confused all about GA4?
If you still need help with the new face of Universal Analytics, you can read our article about GA4 and then contact us. We’ll be happy to consult for anything about GA4. Besides, we build custom solutions for our business partners.