Comparing competitor sites’ sitemaps at the n-gram level can help you find strategic vulnerabilities that will make you stand out.
The n-gram is a contiguous sequence of “n” items of a given text or speech sample. It breaks down a text block into “n” pieces, examining the likelihood of each piece following its predecessor. With our Python Script, you can compare the content of 2 website sitemaps on the n-gram level.

How does your content compare to your strongest competitor? To answer this question, we build a small Python Script that does the following tasks:
- Download the sitemaps of the domains you want to compare.
- Parse all URLs that are found in the sitemap and count n-grams.
- Calculate the n-gram frequency in percent for each website to make them comparable.
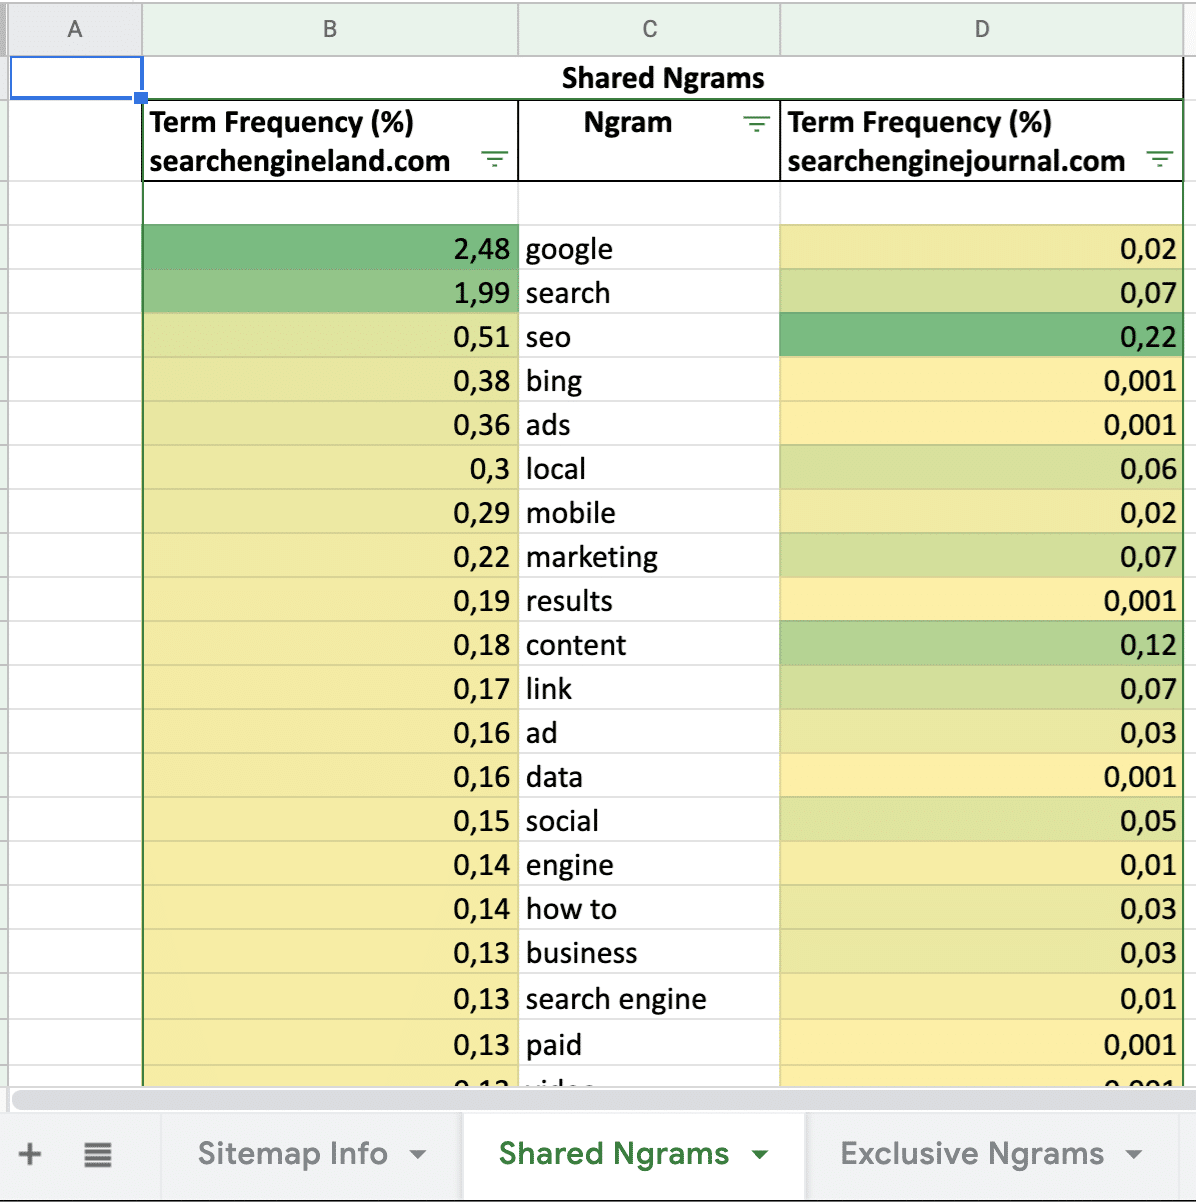
- Analyze the content focus for shared n-grams (both websites use the same words).
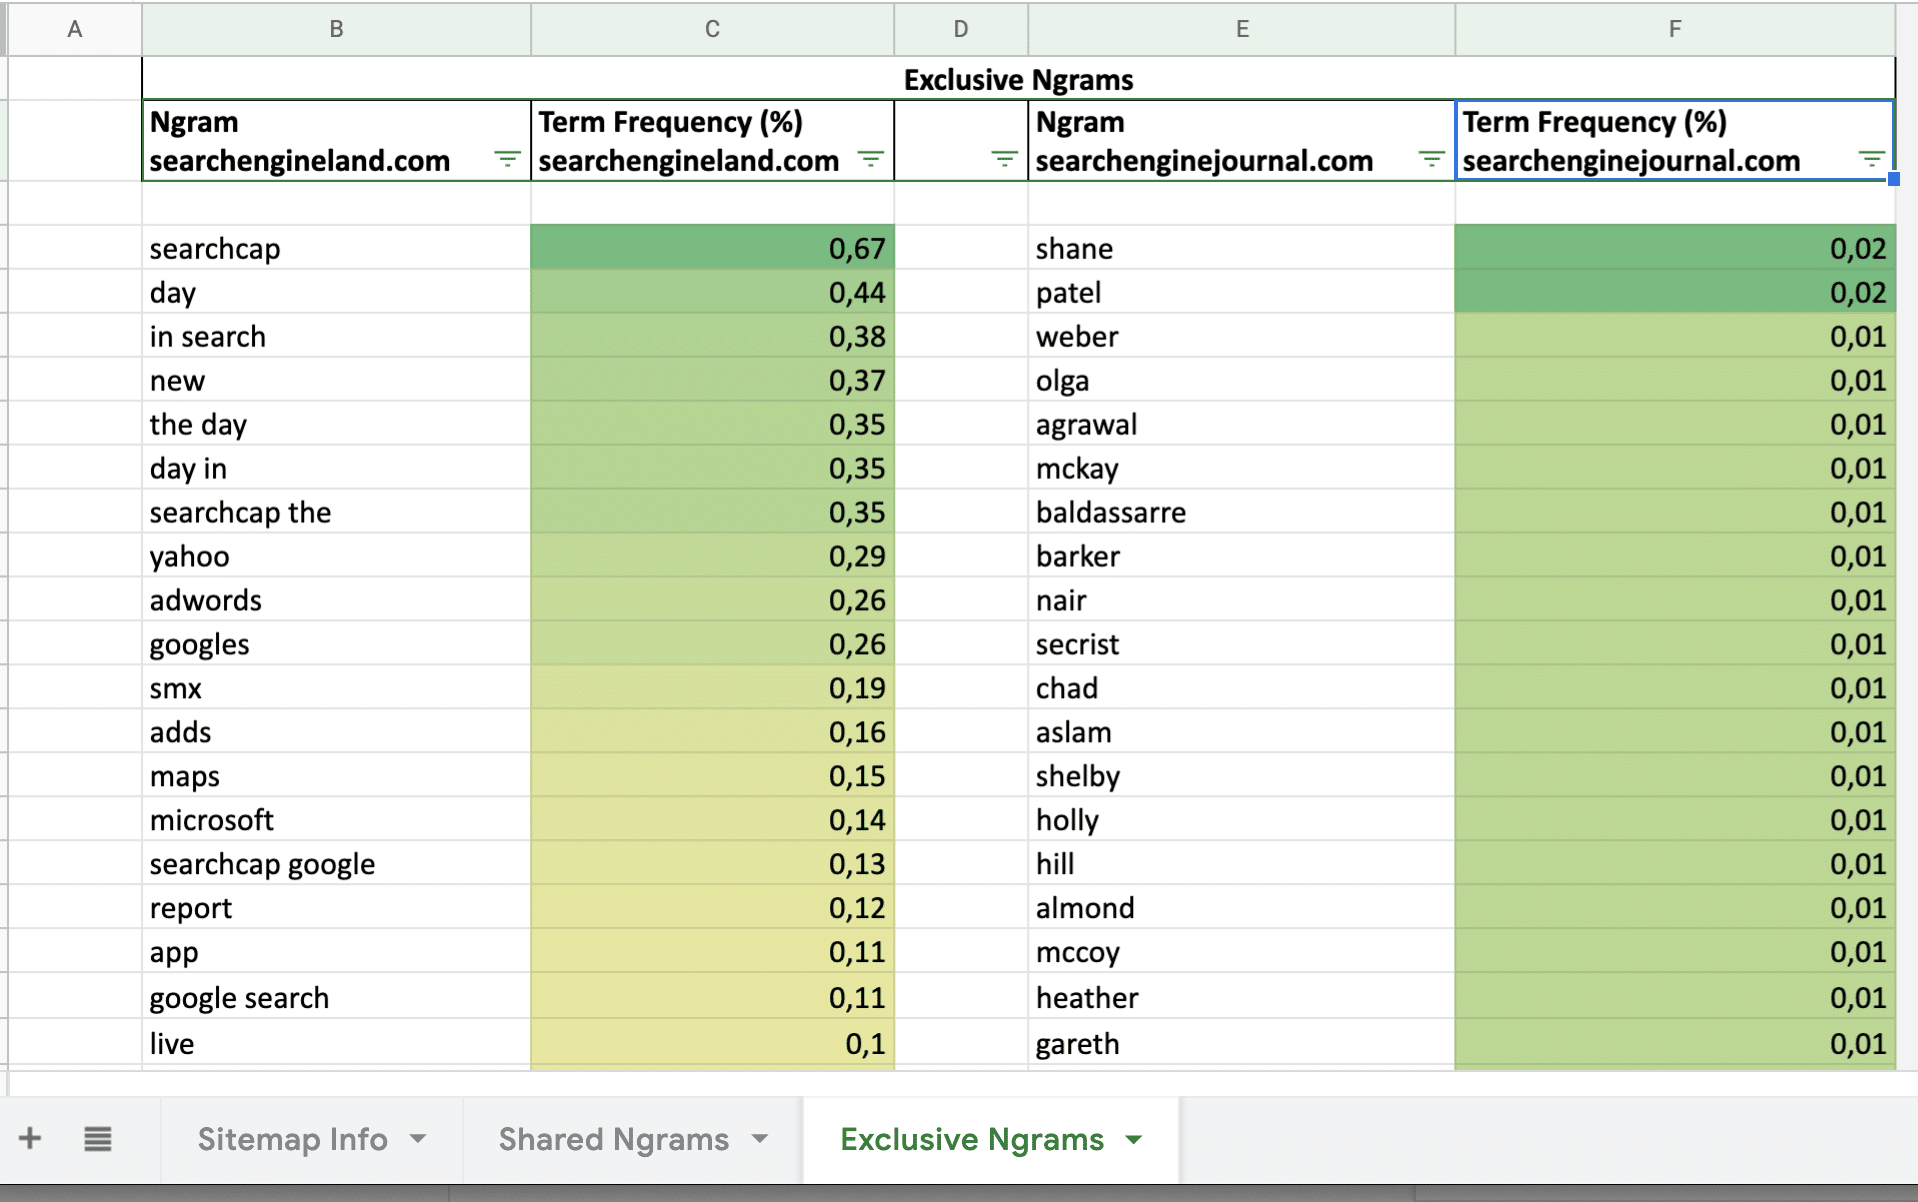
- Analyze the content gaps (one website uses n-grams that aren’t used by the other website).
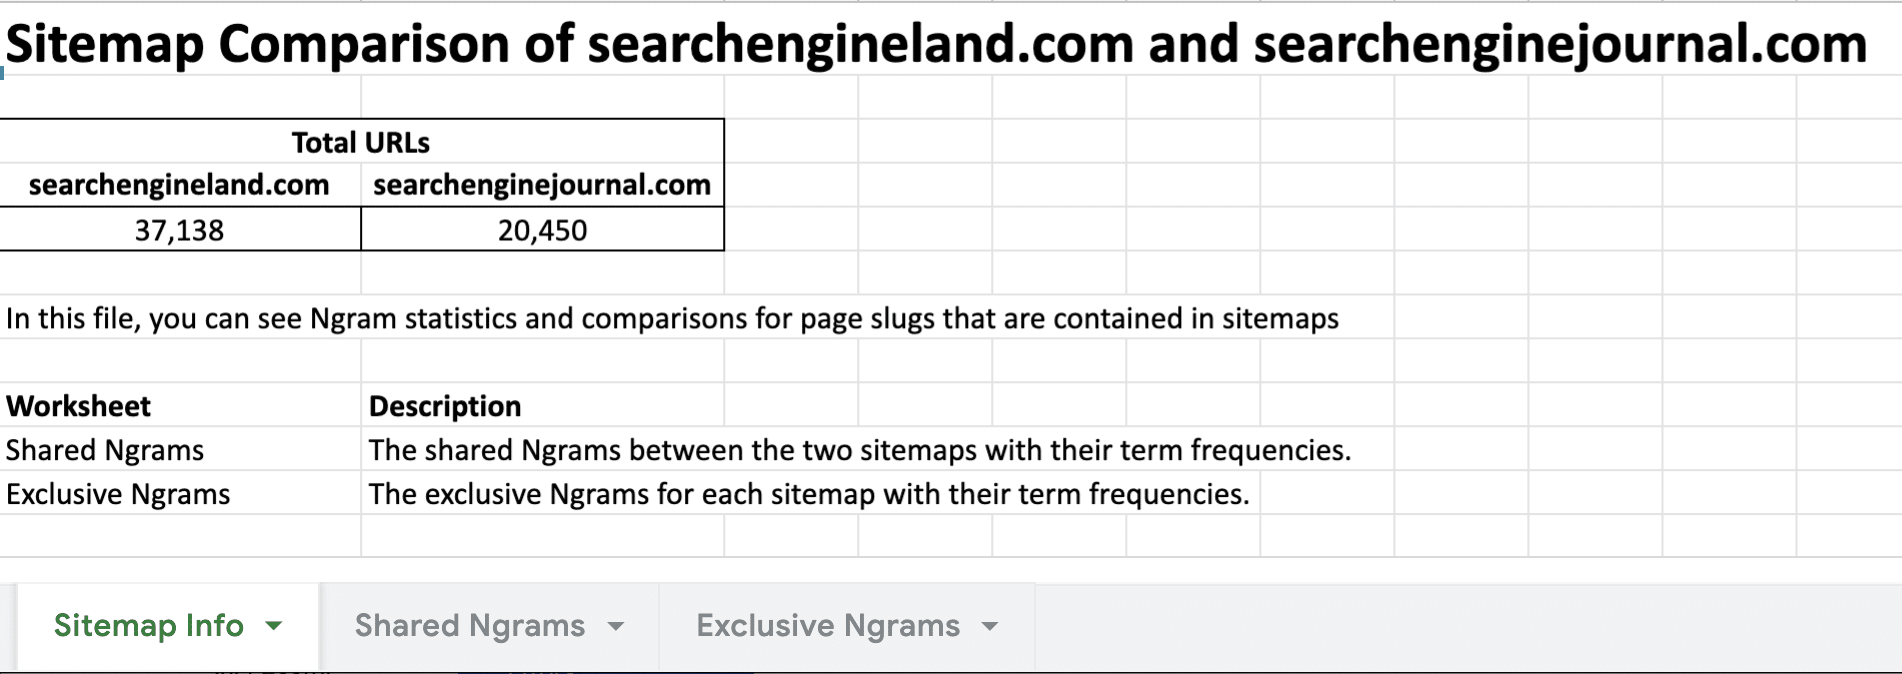
To give you an example of the results, we compared searchengineland.com vs. searchenginejournal.com. When you run the Python Script, you’ll receive an Excel file that contains the following data:
Python script for analyzing
Here you can find the Python Script for running that analysis. Just change the 2 Sitemap URLs to your needs and run the script. All results are saved like in the screenshots:
# Pemavor.com Sitemap Content Comparison
# Author: Stefan Neefischer (stefan.neefischer@gmail.com)

#pip install openpyxl==3.0.4

from openpyxl.formatting.rule import ColorScale, FormatObject, Rule
from openpyxl.styles import colors, Border, Side, Font, Alignment
from openpyxl.worksheet.table import Table
from urllib.request import urlparse
import advertools as adv
import pandas as pd

# ENTER THE URLS OF THE SITES THAT YOU WANT TO COMPARE
site1 = "https://WEBSITE_A/sitemap.xml"
#site2 = 'https://searchengineland.com/sitemap_index.xml'
site2="https://WEBSITE_B/sitemap.xml"
# The result will save in sitemap_comparison.xlsx file

site1_name = urlparse(site1).netloc.replace('www.', '')
site2_name = urlparse(site2).netloc.replace('www.', '')

def sitemap_ngram_analyzer(site):

    sitemap = adv.sitemap_to_df(site)
    sitemap = sitemap.dropna(subset=["loc"]).reset_index(drop=True)

    total_url_count = sitemap.shape[0]

    # Some sitemaps keeps urls with "/" on the end, some is with no "/"
    # If there is "/" on the end, we take the second last column as slugs
    # Else, the last column is the slug column
    slugs = sitemap['loc'].dropna()[sitemap['loc'].dropna().str.endswith('/')].str.split('/').str[-2].str.replace('-', ' ')
    slugs2 = sitemap['loc'].dropna()[~sitemap['loc'].dropna().str.endswith('/')].str.split('/').str[-1].str.replace('-', ' ')

    # Merge two series
    slugs = list(slugs) + list(slugs2)
    slugs = list(set(slugs))

    # adv.word_frequency automatically removes the stop words
    onegram_df = adv.word_frequency(slugs)
    twogram_df = adv.word_frequency(slugs, phrase_len=2)

    onegram_df['word'] = onegram_df['word'].astype(str)
    twogram_df['word'] = twogram_df['word'].astype(str)

    output_csv = pd.concat([onegram_df, twogram_df], ignore_index=True)\
                    .rename({'abs_freq':'Count','word':'Ngram'}, axis=1)\
                    .sort_values('Count', ascending=False)

    return output_csv, total_url_count

# call sitemap Ngram analyzer
df1, df1_url_count = sitemap_ngram_analyzer(site1)
df2, df2_url_count = sitemap_ngram_analyzer(site2)

#######  Creating Excel File  #######

site1_url_count = f'{df1_url_count:,}'
site2_url_count = f'{df2_url_count:,}'

total_url_df = pd.DataFrame([{site1_name: site1_url_count, site2_name: site2_url_count}])

desc1 = 'The shared Ngrams between the two sitemaps with their term frequencies.'
desc2 = 'The exclusive Ngrams for each sitemap with their term frequencies.'

df1_sum = df1['Count'].sum()
df2_sum = df2['Count'].sum()

ratio1_name = 'Term Frequency (%)\n' + site1_name
ngram1_name = 'Ngram\n' + site1_name
ratio2_name = 'Term Frequency (%)\n' + site2_name
ngram2_name = 'Ngram\n' + site2_name

merged_df = pd.merge(df1, df2, how='outer', on='Ngram', indicator=True)

merged_df[ratio1_name] = merged_df['Count_x'].apply(lambda x: round( (x / df1_sum)*100, 2))
merged_df[ratio2_name] = merged_df['Count_y'].apply(lambda x: round( (x / df2_sum)*100, 2))
merged_df.drop(['Count_x','Count_y'], axis=1, inplace=True)
merged_df = merged_df.dropna(subset=['Ngram']).reset_index(drop=True)
merged_df[[ratio1_name, ratio2_name]] = merged_df[[ratio1_name, ratio2_name]].replace(0, 0.001)

common_words = merged_df[merged_df['_merge'] == 'both'][[ratio1_name,'Ngram',ratio2_name]]
common_words = common_words.sort_values(ratio1_name, ascending=False)
common_words.columns = pd.MultiIndex.from_product([['Shared Ngrams'], common_words.columns])

just_left = merged_df[merged_df['_merge'] == 'left_only'][['Ngram',ratio1_name]]
just_left.loc[-1] = None,None
just_left = just_left.sort_index().reset_index(drop=True)
just_left = just_left.rename({'Ngram':ngram1_name}, axis=1)

just_right = merged_df[merged_df['_merge'] == 'right_only'][['Ngram',ratio2_name]]
just_right.loc[-1] = None,None
just_right = just_right.sort_index().reset_index(drop=True)
just_right = just_right.rename({'Ngram':ngram2_name}, axis=1)

first = FormatObject(type='min')
second = FormatObject(type='max')

color_scale = ColorScale(cfvo=[first, second], color=[colors.Color("ffef9c"), colors.Color("63be7b")])
rule = Rule(type='colorScale', colorScale=color_scale)

color_scale2 = ColorScale(cfvo=[first, second], color=[colors.Color("b0eeff"), colors.Color("2294e6")])
rule2 = Rule(type='colorScale', colorScale=color_scale2)

color_scale3 = ColorScale(cfvo=[first, second], color=[colors.Color("fff2c9"), colors.Color("f7ba00")])
rule3 = Rule(type='colorScale', colorScale=color_scale3)

with pd.ExcelWriter('sitemap_comparison.xlsx', engine="openpyxl") as writer:
    total_url_df.to_excel(writer, sheet_name='Sitemap Info', startrow=3, startcol=1, index=False)
    common_words.to_excel(writer, sheet_name='Shared Ngrams')
    just_left.to_excel(writer, sheet_name='Exclusive Ngrams', startrow=1, startcol=1, index=False)
    just_right.to_excel(writer, sheet_name='Exclusive Ngrams', startrow=1, startcol=4, index=False)

    worksheet = writer.sheets['Sitemap Info']

    worksheet.column_dimensions['B'].width = 22
    worksheet.column_dimensions['C'].width = 22

    worksheet['B1'] = f'Sitemap Comparison of {site1_name} and {site2_name}'
    worksheet['B1'].font = Font(bold=True, size='21')

    worksheet['B3'] = 'Total URLs'
    worksheet['B3'].font = Font(bold=True)
    worksheet['B3'].border = Border(top=Side(border_style='thin', color='000000'),
                                    left=Side(border_style='thin', color='000000'),
                                    bottom=Side(border_style=None))
    worksheet['C3'].border = Border(top=Side(border_style='thin', color='000000'),
                                    right=Side(border_style='thin', color='000000'),
                                    bottom=Side(border_style=None))
    worksheet['B4'].border = Border(top=Side(border_style=None),
                                    right=Side(border_style=None),
                                    left=Side(border_style='thin', color='000000'))
    worksheet['C4'].border = Border(top=Side(border_style=None),
                                    left=Side(border_style=None),
                                    right=Side(border_style='thin', color='000000'))
    worksheet['B5'].border = Border(left=Side(border_style='thin', color='000000'),
                                    bottom=Side(border_style='thin', color='000000'),
                                    right=Side(border_style='thin', color='000000'),
                                    top=Side(border_style='thin', color='000000'))
    worksheet['C5'].border = Border(right=Side(border_style='thin', color='000000'),
                                    bottom=Side(border_style='thin', color='000000'),
                                    top=Side(border_style='thin', color='000000'))

    worksheet.merge_cells('B3:C3')
    worksheet['B3'].alignment = Alignment(horizontal='center')
    worksheet['B5'].alignment = Alignment(horizontal='center')
    worksheet['C5'].alignment = Alignment(horizontal='center')

    worksheet['B7'] = 'In this file, you can see Ngram statistics and comparisons for page slugs that are contained in sitemaps'

    worksheet['B9'] = 'Worksheet'
    worksheet['B10'] = 'Shared Ngrams'
    worksheet['B11'] = 'Exclusive Ngrams'
    worksheet['C9'] = 'Description'
    worksheet['C10'] = desc1
    worksheet['C11'] = desc2
    worksheet['B9'].font = Font(bold=True)
    worksheet['C9'].font = Font(bold=True)

    ############ Shared Ngrams Part ############

    worksheet = writer.sheets['Shared Ngrams']

    worksheet.column_dimensions['B'].width = 22
    worksheet.column_dimensions['D'].width = 22
    worksheet.column_dimensions['C'].width = 17

    worksheet['B2'].alignment = Alignment(wrapText=True)
    worksheet['D2'].alignment = Alignment(wrapText=True)

    end = worksheet["A"][-1].coordinate
    for row1 in worksheet[f'A1:{end}']:
          for cell1 in row1:
            cell1.value = None
            cell1._style = worksheet['L2']._style

    start = worksheet["B"][1].coordinate
    end1 = worksheet["B"][-1].coordinate
    worksheet.conditional_formatting.add(f"{start}:{end1}", rule)

    start = worksheet["D"][1].coordinate
    end = worksheet["D"][-1].coordinate
    worksheet.conditional_formatting.add(f"{start}:{end}", rule)

    end = 3 + common_words.shape[0]
    worksheet.auto_filter.ref = f"B2:D{end}"

    ############ Exclusive Ngrams Part ############

    worksheet = writer.sheets['Exclusive Ngrams']

    worksheet['B1'] = 'Exclusive Ngrams'
    worksheet['B1'].font = Font(bold=True)

    worksheet['B1'].border = Border(top=Side(border_style='thin', color='000000'),
                                    left=Side(border_style='thin', color='000000'))
    worksheet['C1'].border = Border(top=Side(border_style='thin', color='000000'))
    worksheet['D1'].border = Border(top=Side(border_style='thin', color='000000'),
                                    bottom=Side(border_style='thin', color='000000'))
    worksheet['E1'].border = Border(top=Side(border_style='thin', color='000000'))
    worksheet['F1'].border = Border(right=Side(border_style='thin', color='000000'),
                                    top=Side(border_style='thin', color='000000'))
    worksheet['D2'].border = Border(bottom=Side(border_style='thin', color='000000'),
                                    top=Side(border_style='thin', color='000000'))

    worksheet.merge_cells('B1:F1')
    worksheet['B1'].alignment = Alignment(horizontal='center')

    worksheet['B2'].alignment = Alignment(wrapText=True)
    worksheet['C2'].alignment = Alignment(wrapText=True)
    worksheet['E2'].alignment = Alignment(wrapText=True)
    worksheet['F2'].alignment = Alignment(wrapText=True)

    worksheet.column_dimensions['B'].width = 22
    worksheet.column_dimensions['C'].width = 22
    worksheet.column_dimensions['E'].width = 22
    worksheet.column_dimensions['F'].width = 22

    ### Make table for filtering
    end = 2 + just_left.shape[0]
    tab1 = Table(displayName="Table1", ref=f"B2:C{end}")
    worksheet.add_table(tab1)

    end = 2 + just_right.shape[0]
    tab2 = Table(displayName="Table2", ref=f"E2:F{end}")
    worksheet.add_table(tab2)

    start = worksheet["C"][1].coordinate
    end = worksheet["C"][-1].coordinate
    worksheet.conditional_formatting.add(f"{start}:{end}", rule)

    start = worksheet["F"][1].coordinate
    end = worksheet["F"][-1].coordinate
    worksheet.conditional_formatting.add(f"{start}:{end}", rule)

    writer.save()

    print("Excel file saved")
Sitemap Content Analyzer Tool
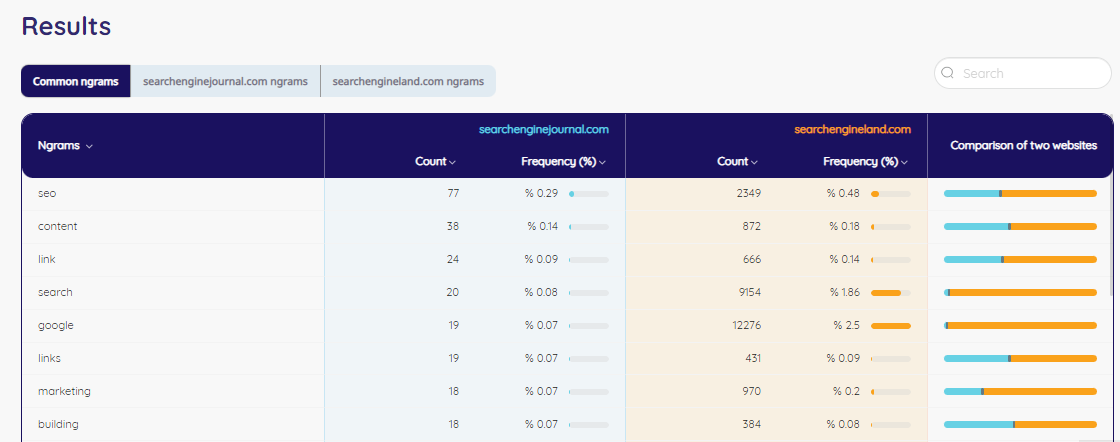
If you struggle with Python Scripts, our Sitemap Content Analyzer Tool is for you. It makes it easier to analyze the sitemap with one click. After checking the results, you can find new content opportunities. This will give you more chances to rank higher on SERP (Search Engine Result Page).
In seconds, you’ll get the results of your competitor’s sitemap.
- Paste sitemap links.
- Check your results.
- Analyze your competitor’s content.
Do you need custom Python Scripts?
It’s possible with PEMAVOR. We analyze our customer’s needs and business goals and create custom Python Scripts. Your success is our success. Let’s talk about finding the most effective solutions for your company.