Intro: Google changed the Search Term Performance Report
Google announced in September 2021 that there will be some major changes to their Search Term Performance Reports. This time, Google is going the opposite way than last time: There should be more search term data than ever before in order to provide more insights for campaign optimizations. Sounds great this time! Let’s have a closer look what really changed in the recent Google updates and what it means for your daily work.
…you want more data. Since then, we’ve been exploring new, privacy-safe ways to get you the insights you need to run more effective campaigns.
https://support.google.com/google-ads/answer/11127882
Google’s claim is to create actionable insights — in this article, you’ll get an answer on that.
First Impression: What does “more queries” mean?
This data will now be shown in your reports for queries you received starting from February 1, 2021
https://support.google.com/google-ads/answer/11127882
Google is showing the new enriched search term performance report starting from February 1, 2021. This is very helpful for understanding the changes in a detailed way as we can consider, e.g., January 2021 as time period to compare with.
How did we make our analysis?
We’re fetching all data using the Google Ads reporting API. The data is stored to Google Big Query, where we’re able to run SQL statements and use it as data source for some Google data studio dashboards. We’re doing this for a Google Shopping and a Keyword Account for DE market.
Changes in row count of the search term report: January 2021 vs. February 2021
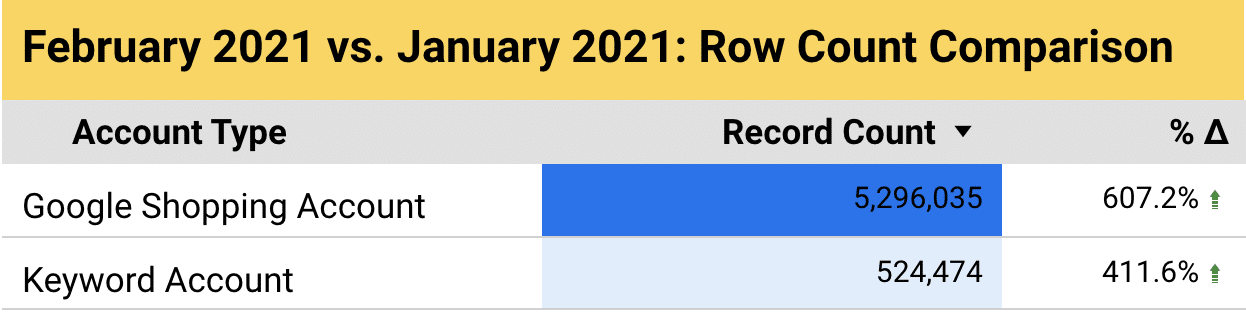
The report size exploded after Google’s change on the report. Depending on account type, we saw changes from +400 to +600% in report size. This is huge!
Too good to be true? Let’s find out…
How does the additional query data look like in detail?
Google is claiming that these changes will help us run campaigns more effectively. Before we get in detail on this statement, let’s make a short recap, how Google changes regarding search queries led to some bad user feedback:
- Search Queries were removed in the past, and a lot of queries with cost and conversion data were not visible anymore. In other words: You don’t know for which queries you’re paying for in detail. As a result, not also processes of adding new money keywords, but also identifying negative keywords became more difficult.
- Google is changing how match types are working: Even exact match keywords started to match queries as “Close Variants” that are performing very poor. This can bring your overall performance down. The problem: when you can’t see those matches, you can’t blame Google for that. Blocking those unknown queries by setting negative keywords will also not work.
Segmentation based on Click data
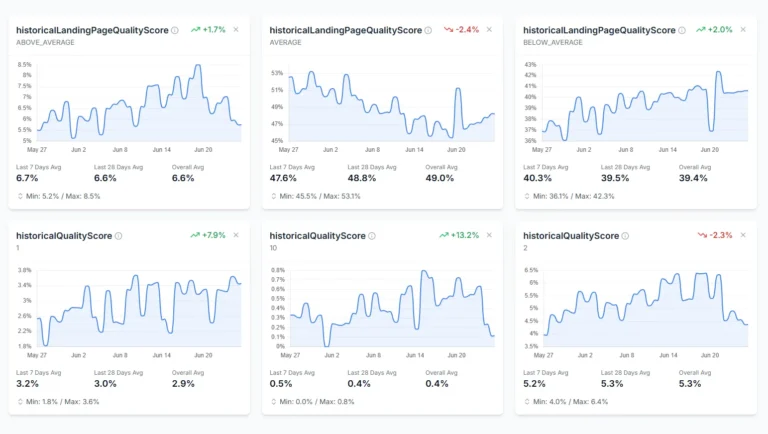
If we want to bring useful actions to the Google accounts with the new search query performance report, one thing is clear: There must be a growing number of queries that have at least some click data to judge their performance. For that reason, I added some additional segments to my reports: Queries with Clicks = 0 and Queries with Clicks >= 1
By looking at this perspective, my excitement of having 5-7 times more data to gain actionable insights turned to disappointment: Nearly all queries that are new in the reports do not have any click data:
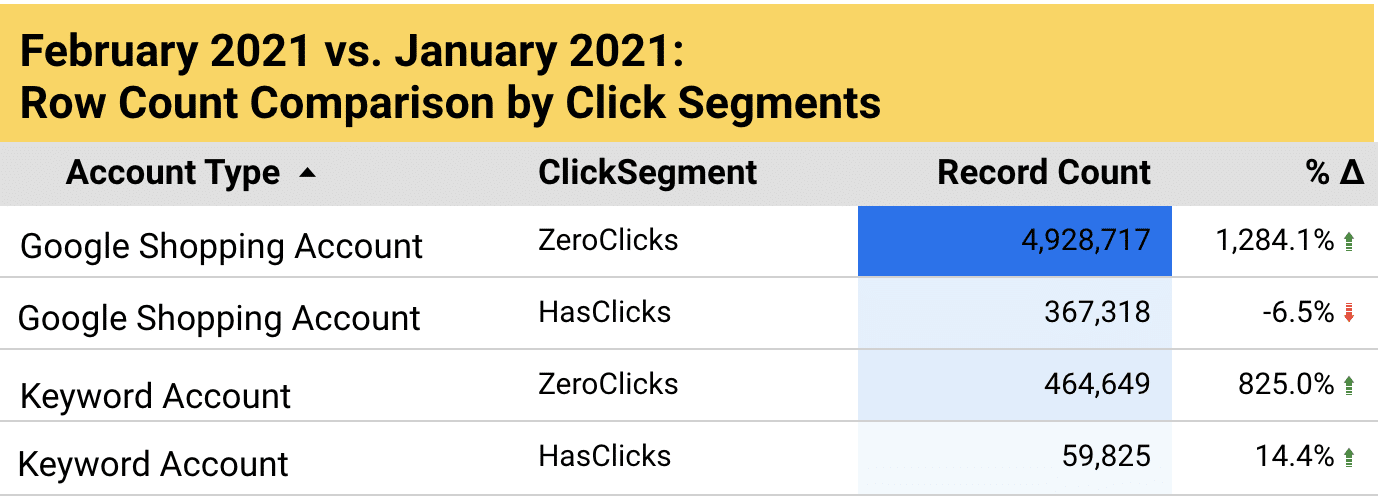
Having more available search queries has no effects of identifying valuable search terms and negative keywords. The processing of those tasks will become more resource consuming because of bigger report sizes if you do not apply filters.
What is the “nature” of those new Zero-Click Search Terms?
We’re talking of millions of new search queries within the accounts we analyzed — just for February 2021. But scanning manually caught our attention already on some patterns:
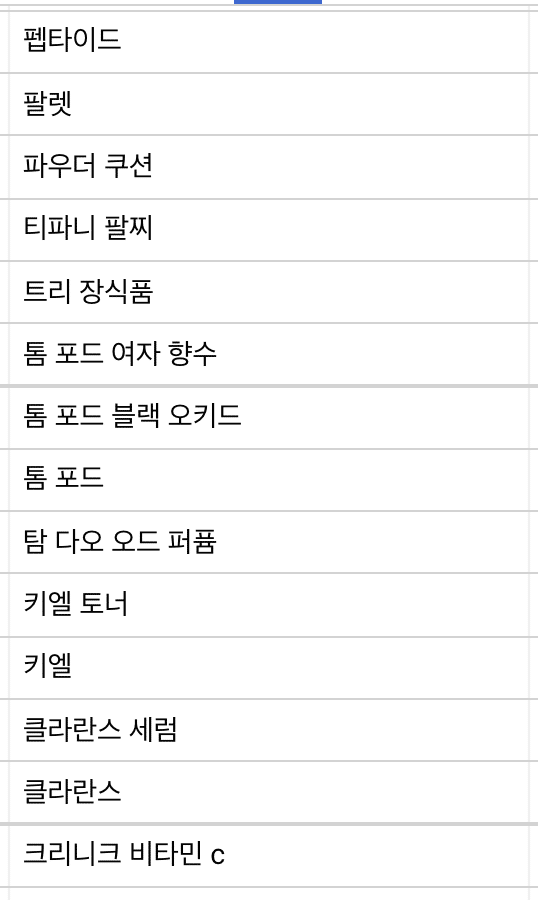
- Emojis appear in Queries across all devices:
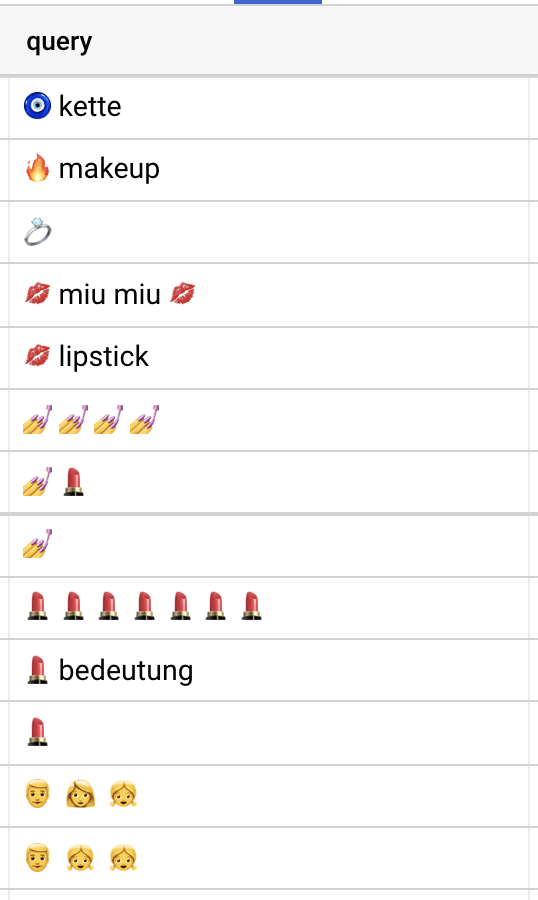
- A lot of different languages appeared within the queries
However, this manual approach probably won’t tell the full story when talking about millions of additional search queries. Let’s break it down to numbers…
Query transformation to their n-grams
If you haven’t heard about n-grams before: You simply split queries into words. The idea: If a lot of additional queries appear in the February report because of different word orders, the number of unique n-grams still would be the same. However, the numbers showed also a big increase on n-gram Level:
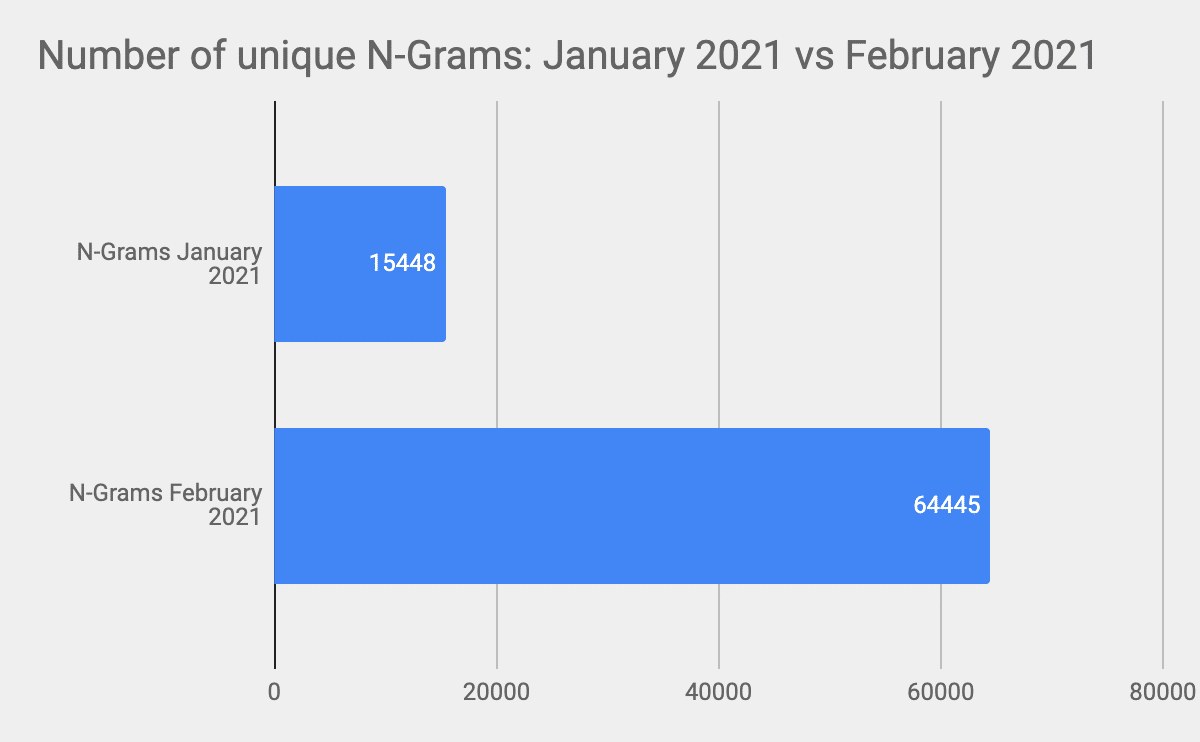
No way, the vocabulary increased 4 times: Searching for explanations with String Similarity
To be honest: The numbers above surprised me because there is no way that the search vocabulary increased that much. For that reason, the next step to explain the gap is to look at string similarity of the January n-grams vs. February 2021. Are the new words “close variants” of n-grams that appeared already in January 2021? You find more information about the String Similarity approach here — we used it also in our Close Variant Analyzer.
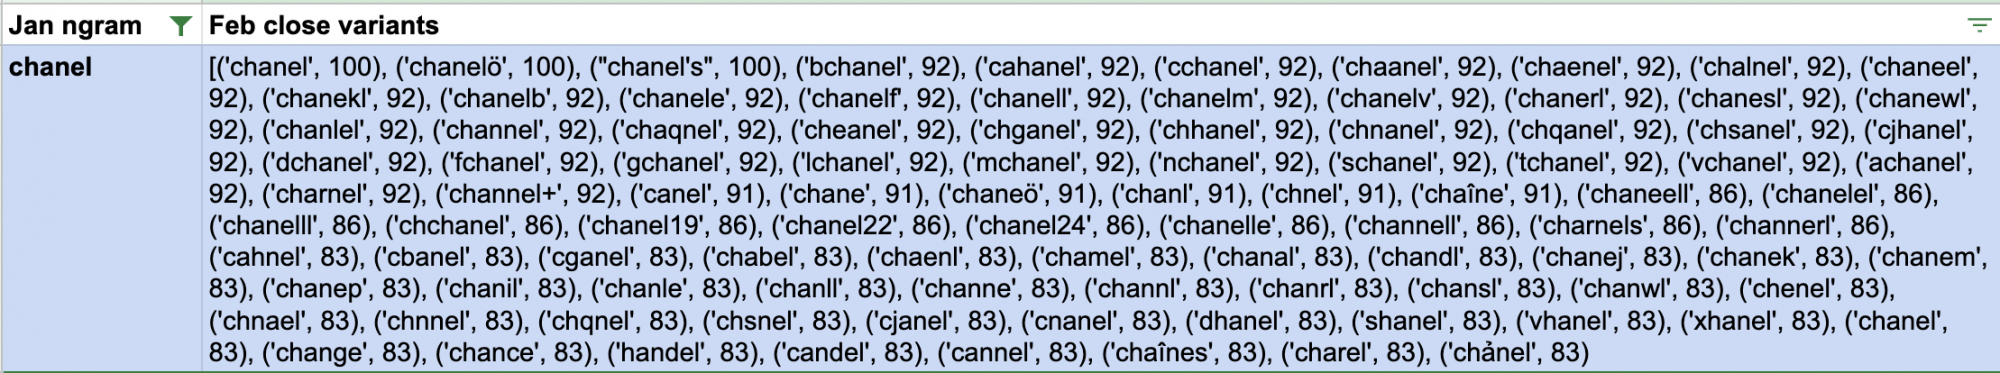
The following screenshot shows close variants of the n-gram “chanel” that appeared in the February report, the number behind each match shows the string similarity:
When the logic is applied on the full n-gram set, it’s getting clear where the query growth is coming from:
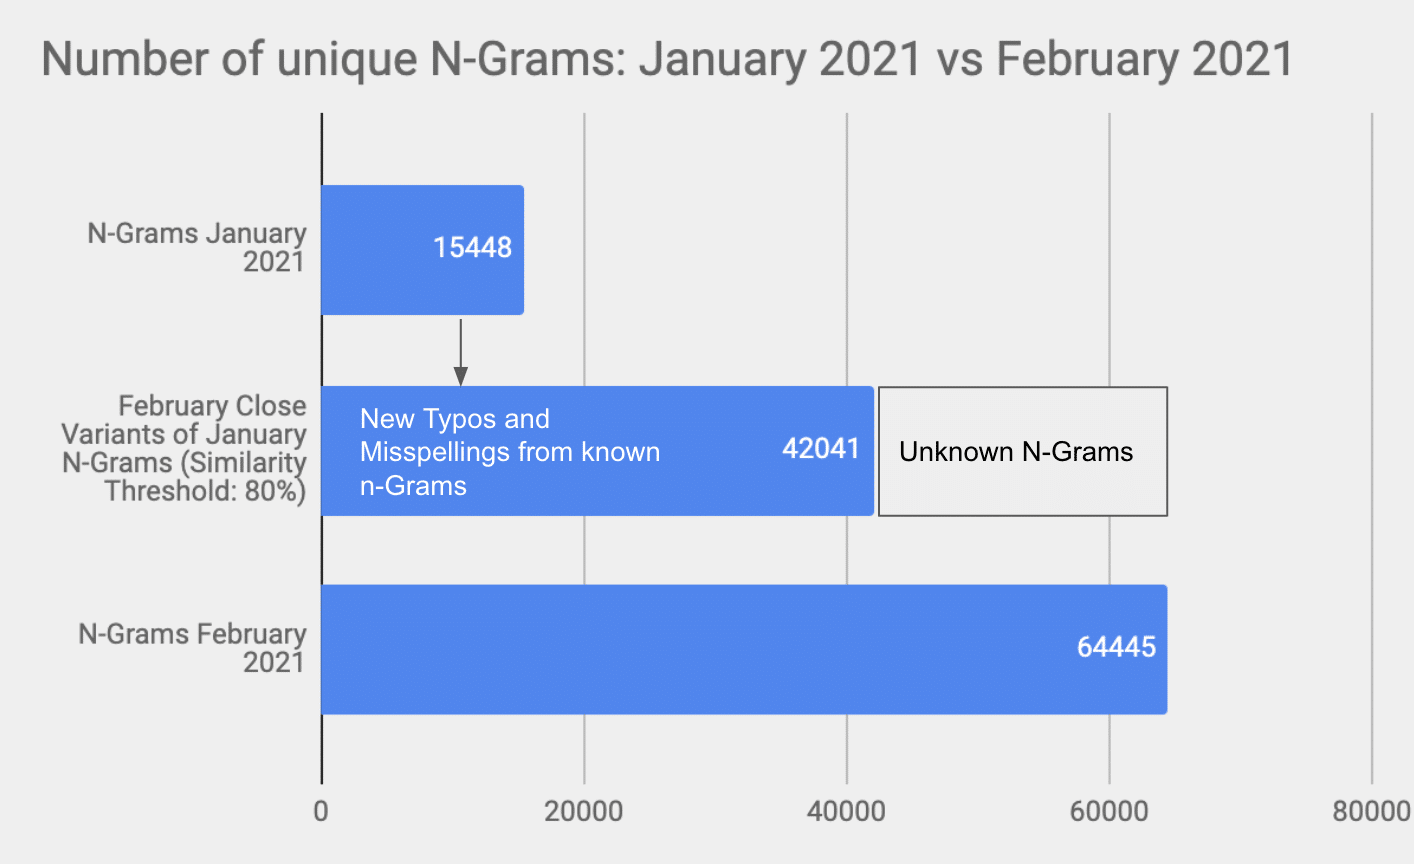
Around 65% of the February n-grams are not new and can be explained with the n-grams from January and its close variants. The remaining gap is probably explainable with close variants as well if consider a bigger time period to compare the February 2021 search data with (We only used January, it’s normal that there is no full coverage of n-grams).
So what exactly happened: Google is matching a lot of search queries to your existing search queries with close variants now. It’s becoming obvious when you see the exploding number of close variant n-grams. This is more visible now with the updates of the Search Term Performance Report.
What is the cost share that can be explained with the search term performance report?
On which queries do you spend your budget? This is crucial for optimizing your Google Ads Performance. To answer that question, we compared the aggregated cost data of the search term report with the cost data we’re getting from the account performance report. The delta tells us the size of the blind spot regarding search terms:
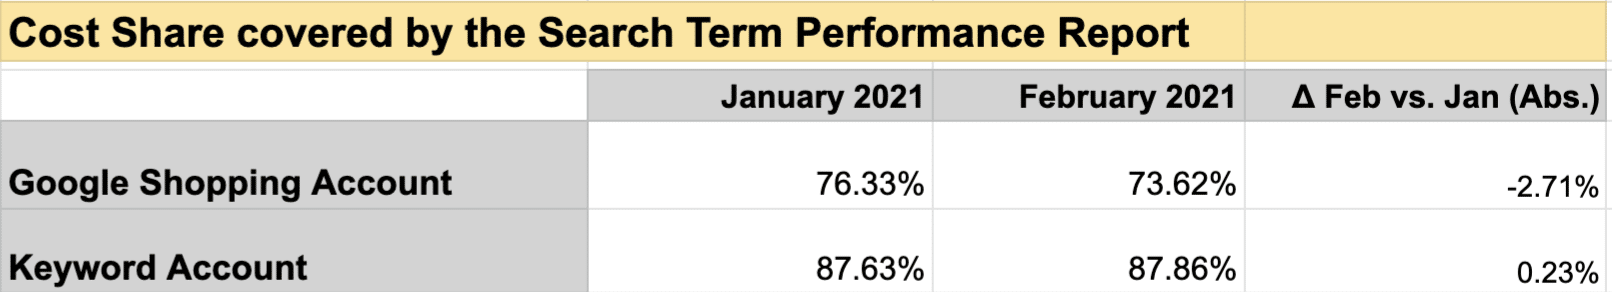
Looking at the numbers shows what happened regarding more cost transparency: nothing changed! This isn’t a big surprise because we already know that most of the new queries have zero clicks and costs.
(FYI: Maybe the total numbers of the cost coverage look different for your accounts: The reason might be that the shown accounts use sophisticated negative keyword approaches)
Bottom Line: What does the additional query data mean for account optimization?
By looking it the numbers, it became obvious what happened in Google’s changes:
- Google is providing you tons of additional query data. The additional data is mainly driven by queries that caused no Clicks, Costs, and Conversions at all.
- There is no added value for identifying new good converting keywords or bad performing search patterns
- There is no added transparency in the Search Term Report when it comes to explaining on which queries you spend the budget
- Existing Tasks based on the Search Query Performance Report will need more resources / computation power because of the heavily increased amount of data. Filtering out queries without clicks might be a good option.