After Google’s important update on February 5, 2025, keeping an eye on your Landing Page Quality Score (LPQS) is more crucial than ever. Instead of checking data manually for all your accounts, you can now get daily Quality Score reports automatically for your entire Google Ads Manager Account (MCC) using our Ads Health Checker script.
This guide will walk you through setting up and using the script. You’ll also find the full script code, plus an invitation to try our ready-to-use Ads Health Checker dashboard.
For more details on why LPQS is so important and how the recent Google update impacts your ads, check out our previous article: Boost your search ad Landing Page Quality Score: Key insights from Google’s latest update.

 This tool helps you:
Setting up the Ads Health Checker Script
Create your destination Google Sheet
First, you’ll need a place for your data to go.- Sign in to Google Drive using your Google Ads Manager (MCC) account.
- Create a new blank Google Sheet and give it a clear name, like “Quality Score Daily Tracker.”
- Copy the Sheet’s ID from the web address. This is the long string of characters you see between /d/ and /edit/ in the URL.
-
- Example: https://docs.google.com/spreadsheets/d/YOUR_SHEET_ID_HERE/edit
-
Copy the script into Apps Script
Next, you’ll have to insert the script that you’ll find in this post into Google Apps Script.
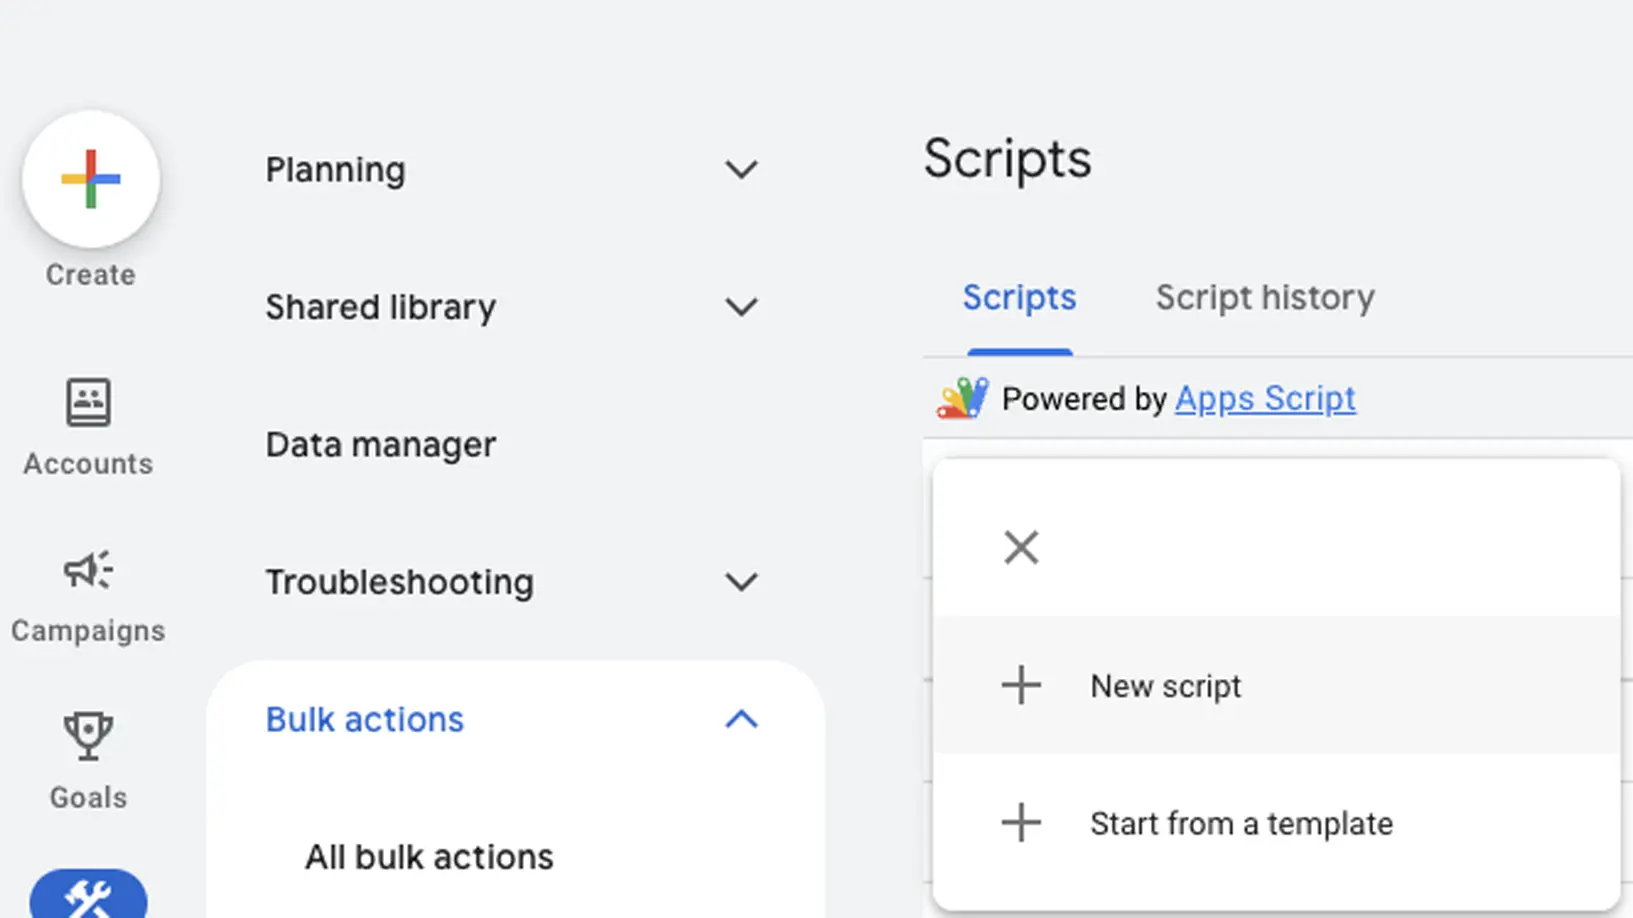
- Go to script.google.com and click New Project.
- In the editor, delete any existing code (usually a default function myFunction() {}).
- Paste the entire script provided in “Full Script Code” section below into the editor.
- At the very top of the script, find the line const SPREADSHEET_ID = ‘YOUR_SHEET_ID_HERE’; and replace ‘YOUR_SHEET_ID_HERE’ with the Sheet ID you copied in the previous step. Make sure to keep the single quotes around the ID.
Grant access and authorize
The script needs your permission to work with your Google Ads and Google Sheets data.- Save the script (you can press Ctrl + S).
- Click the Run ▶ button (it looks like a play button) in the toolbar. This will run the main() function.
- You’ll be asked to authorize certain permissions. Allow these:
- View and manage your Google Ads data: This lets the script get keyword-level Quality Score information from all the accounts under your MCC.
- View and manage your Google Sheets: This lets the script write the QS summaries into your new Google Sheet.
- After you grant permission, the script will run for the first time. It will then fill your Google Sheet with daily QS data for the past 365 days.
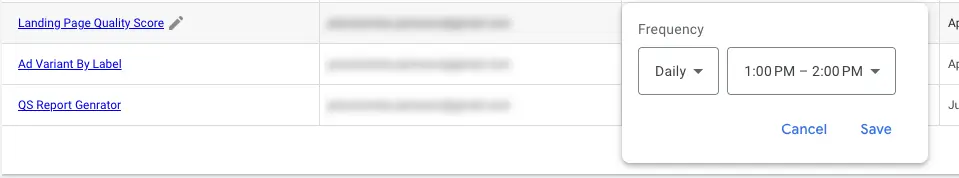
Schedule Daily Execution
To keep your data fresh, schedule the script to run automatically every day. ClickFrequency field of the created script, and select your frequency.
Full script code
Here’s the complete Google Apps Script code. This script goes through each sub-account in your MCC, queries Google Ads for LPQS and other Quality Score metrics, then summarizes and writes this daily data into your chosen Google Sheet. Below is the complete Apps Script code. This script:- Iterates through every sub-account in your MCC.
- Queries Google Ads’ keyword_view for landing_page_experience_quality_score (alongside other QS sub-metrics).
- Aggregates daily counts of “BELOW_AVERAGE,” “AVERAGE,” and “ABOVE_AVERAGE.”
/**
 * Ads Health Checker Script — PEMAVOR
 *
 * Author: Stefan Neefischer
 * Role: VP, Data & Analytics, PEMAVOR GmbH
 * Contact: stefan.neefischer@pemavor.com | support@pemavor.com
 * Hosted Tool: https://adshealthchecker.pemavor.com
 *
 * This script loops through all child accounts under your MCC,
 * pulls historical Quality Score sub-metrics (including Landing Page QS)
 * from Google Ads' keyword_view, aggregates counts by date, and writes
 * the results into a Google Sheet for easy visualization.
 **/

// ---------------------------------
// CONFIGURATION
// ---------------------------------

// 1) Replace with your Google Sheet ID (string between /d/ and /edit in the sheet URL).
const SPREADSHEET_ID = 'SPREADSHEET_ID'; // <<< IMPORTANT: Update this line!

// 2) Time window (in days) for historical data. 365 = one year of daily values.
const TIME_WINDOW = 365;

// 3) List of QS fields to retrieve. Add or remove fields as needed.
const SELECTED_FIELDS = [
  'metrics.historical_quality_score',
  'metrics.historical_creative_quality_score',
  'metrics.historical_landing_page_quality_score',
  'metrics.historical_search_predicted_ctr'
];

// Helper: Convert snake_case to camelCase
function snakeToCamel(s) {
  return s.replace(/_([a-z])/g, (g) => g[1].toUpperCase());
}

// Map: snake_case field → camelCase field
const FIELD_CAMELCASE_MAP = Object.fromEntries(
  SELECTED_FIELDS.map(f => [f, f.replace(/\.([a-z_]+)/g, (m, p1) => '.' + snakeToCamel(p1))])
);
// Example: 'metrics.historical_quality_score' → 'metrics.historicalQualityScore'

/**
 * MAIN FUNCTION
 * • Iterates through each sub-account in your MCC.
 * • Queries keyword_view for QS sub-metrics over the last TIME_WINDOW days.
 * • Aggregates daily counts for each QS category (e.g., BELOW_AVERAGE).
 * • Writes a summary table into the specified Google Sheet.
 */
function main() {
  // 1. Compute date range: from (today – TIME_WINDOW) to (today – 1).
  const today = new Date();
  today.setDate(today.getDate() - 1);   // Yesterday
  const startDate = new Date(today);
  startDate.setDate(today.getDate() - TIME_WINDOW + 1);

  const tz = AdsApp.currentAccount().getTimeZone();
  const dateFormat = 'yyyy-MM-dd';
  const startDateStr = Utilities.formatDate(startDate, tz, dateFormat);
  const endDateStr   = Utilities.formatDate(today, tz, dateFormat);

  Logger.log(`📅 Processing date range: ${startDateStr} → ${endDateStr}`);

  // 2. Container to accumulate daily QS category counts across all accounts.
  const summary = {};
  let accountsProcessed = 0;

  const accountIterator = MccApp.accounts().get();
  const totalAccounts = accountIterator.totalNumEntities();

  // 3. Loop through each sub-account under the MCC.
  while (accountIterator.hasNext()) {
    const account = accountIterator.next();
    MccApp.select(account);
    accountsProcessed++;
    Logger.log(`▶ Processing account ${accountsProcessed}/${totalAccounts} (ID: ${account.getCustomerId()})`);

    // 4. Build the GAQL query for keyword-level QS metrics over the defined date range.
    const query = `
      SELECT
        ad_group_criterion.keyword.text,
        segments.date,
        ${SELECTED_FIELDS.join(', ')}
      FROM keyword_view
      WHERE
        segments.date BETWEEN '${startDateStr}' AND '${endDateStr}'
        AND metrics.impressions >= 0
        AND campaign.advertising_channel_type = 'SEARCH'
    `;

    // 5. Run the query and process results.
    const rows = AdsApp.search(query);
    let rowCount = 0;

    while (rows.hasNext()) {
      const row = rows.next();
      const flatRow = flattenObject(row);
      const date = flatRow['segments.date'];
      if (!date) continue;

      // Initialize daily summary if needed.
      if (!summary[date]) {
        summary[date] = { activeElements: 0 };
      }

      summary[date].activeElements++;
      const daySummary = summary[date];

      // 6. Tally each QS category into daySummary, e.g.:
      //    metrics.historicalLandingPageQualityScore_BELOW_AVERAGE
      for (const [key, value] of Object.entries(flatRow)) {
        if (key === 'segments.date') continue;
        // Use camelCase field names for matching
        if (!Object.values(FIELD_CAMELCASE_MAP).some(field => key.startsWith(field))) continue;

        if (Array.isArray(value)) {
          // Some fields (like primary_status_reasons) are arrays; iterate through each element.
          value.forEach(v => {
            const columnKey = `${key}_${v}`;
            daySummary[columnKey] = (daySummary[columnKey] || 0) + 1;
          });
        } else {
          const columnKey = `${key}_${value}`;
          daySummary[columnKey] = (daySummary[columnKey] || 0) + 1;
        }
      }

      rowCount++;
    }

    Logger.log(`    ✔ Rows processed: ${rowCount}`);
    if (accountsProcessed % 5 === 0 || accountsProcessed === totalAccounts) {
      Logger.log(`--- Completed ${accountsProcessed}/${totalAccounts} accounts ---`);
    }
  }

  // 7. Build header row dynamically, based on all observed summary keys.
  const headersSet = new Set();
  for (const date in summary) {
    Object.keys(summary[date]).forEach(key => headersSet.add(key));
  }
  const headers = ['activeElements', ...Array.from(headersSet).filter(h => h !== 'activeElements').sort()];

  // 8. Write data into the Google Sheet.
  const sheet = SpreadsheetApp.openById(SPREADSHEET_ID).getActiveSheet();
  sheet.clear();  // Clear any existing data
  sheet.appendRow(['Date', ...headers]);

  Object.keys(summary).sort().forEach(date => {
    const counts = headers.map(key => summary[date][key] || 0);
    sheet.appendRow([date, ...counts]);
  });

  Logger.log(`\n✅ Completed processing ${accountsProcessed} accounts.`);
  Logger.log('📄 Data written to Google Sheet successfully.');
}

/**
 * Recursively flattens a nested AdsApp row object into a dot-notated key→value map.
 * Example: { segments: { date: '2025-02-10' }, metrics: { ... } }
 * → { 'segments.date': '2025-02-10', 'metrics.metricName': value, ... }
 */
function flattenObject(obj, prefix = '') {
  const result = {};
  for (const key in obj) {
    if (!obj.hasOwnProperty(key)) continue;
    const val = obj[key];
    const fullKey = prefix ? `${prefix}.${key}` : key;

    if (val !== null && typeof val === 'object' && !Array.isArray(val)) {
      Object.assign(result, flattenObject(val, fullKey));
    } else {
      result[fullKey] = val;
    }
  }
  return result;
}
Want a Clearer View of Your Script Output?
Once your data is collected using the script, you can copy and paste it into our free Google Ads Health Checker tool.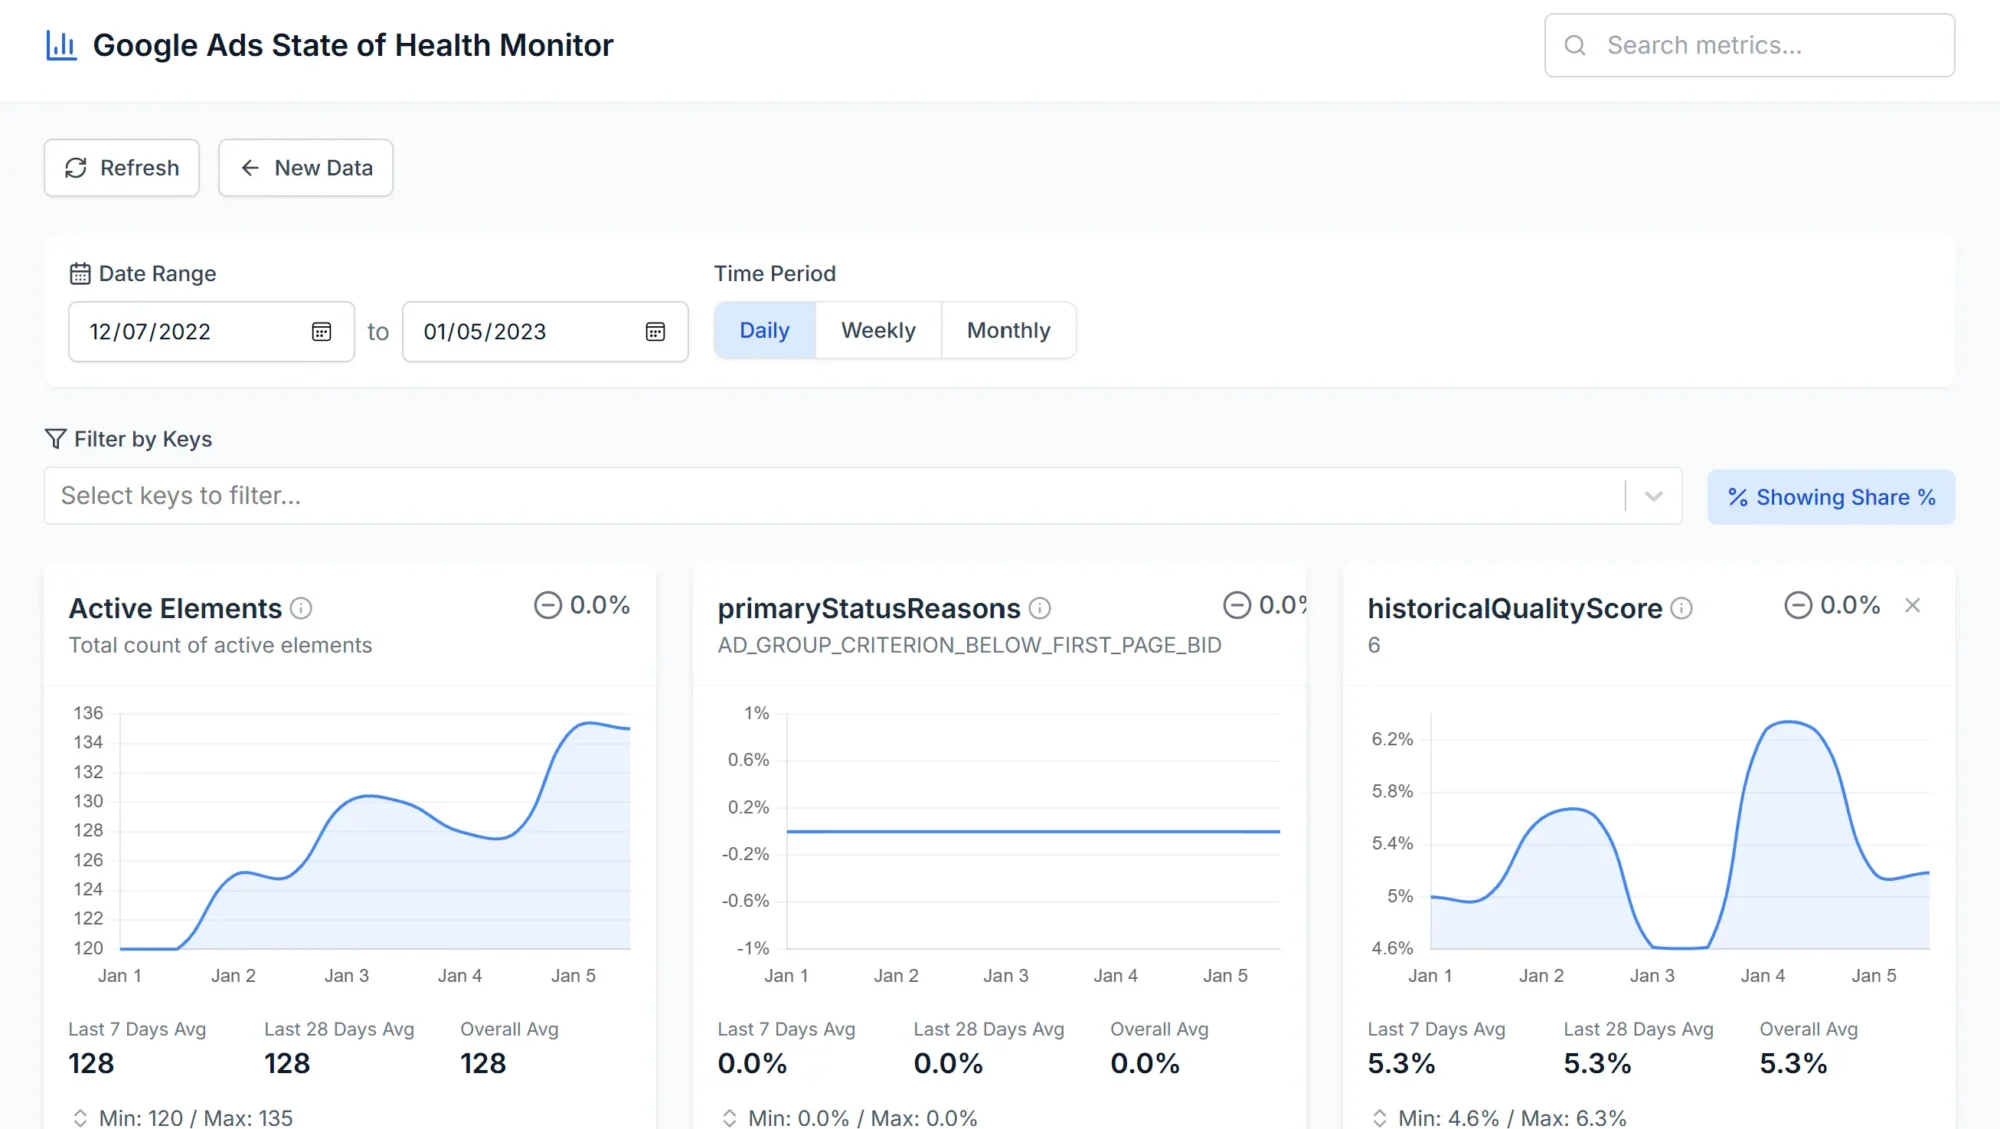 This tool helps you:
- Instant Quality Score Visualization: Break down QS trends over time with daily splits for “Below Average,” “Average,” and “Above Average.
- Spot anomalies and drops in performance across all your accounts.
- Understand the hard-to-read script output through clean charts and summaries.