Google Ads Health Checker
Get Clarity on Your Google Ads Quality Metrics Instantly
- See how your landing page quality evolves over time
- Detect when issues aren’t isolated to one campaign, but span your entire account
- Know which parts of the Quality Score might be hurting your performance
- Turn raw Quality Score data into clear visual insights
Take the guesswork out of Quality Score(QS) monitoring. Identify performance drops before they affect your bottom line.
How Google Ads Health Checker Works
1) Export Quality Score Data
Use our free script below to automatically extract keyword-level QS metrics, including LPQS, Expected CTR, and Ad Relevance, from all accounts under your Google Ads Manager (MCC).
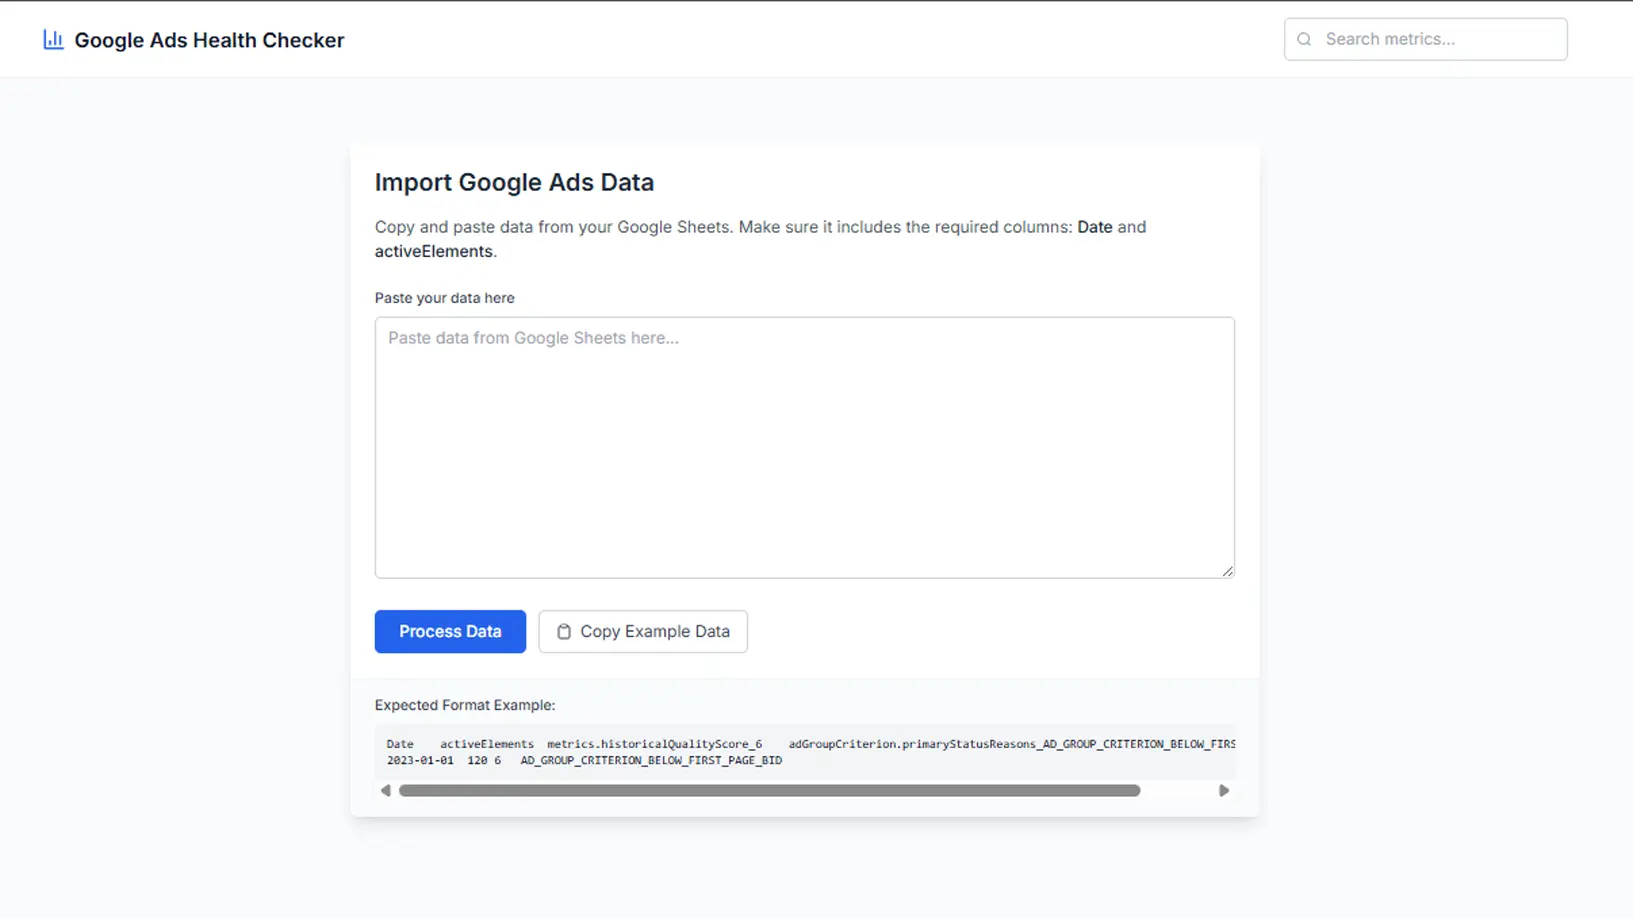
2) Paste Into the Tool
Copy the data from your Google Sheet export and paste it into the dashboard. No email, no sign up required!
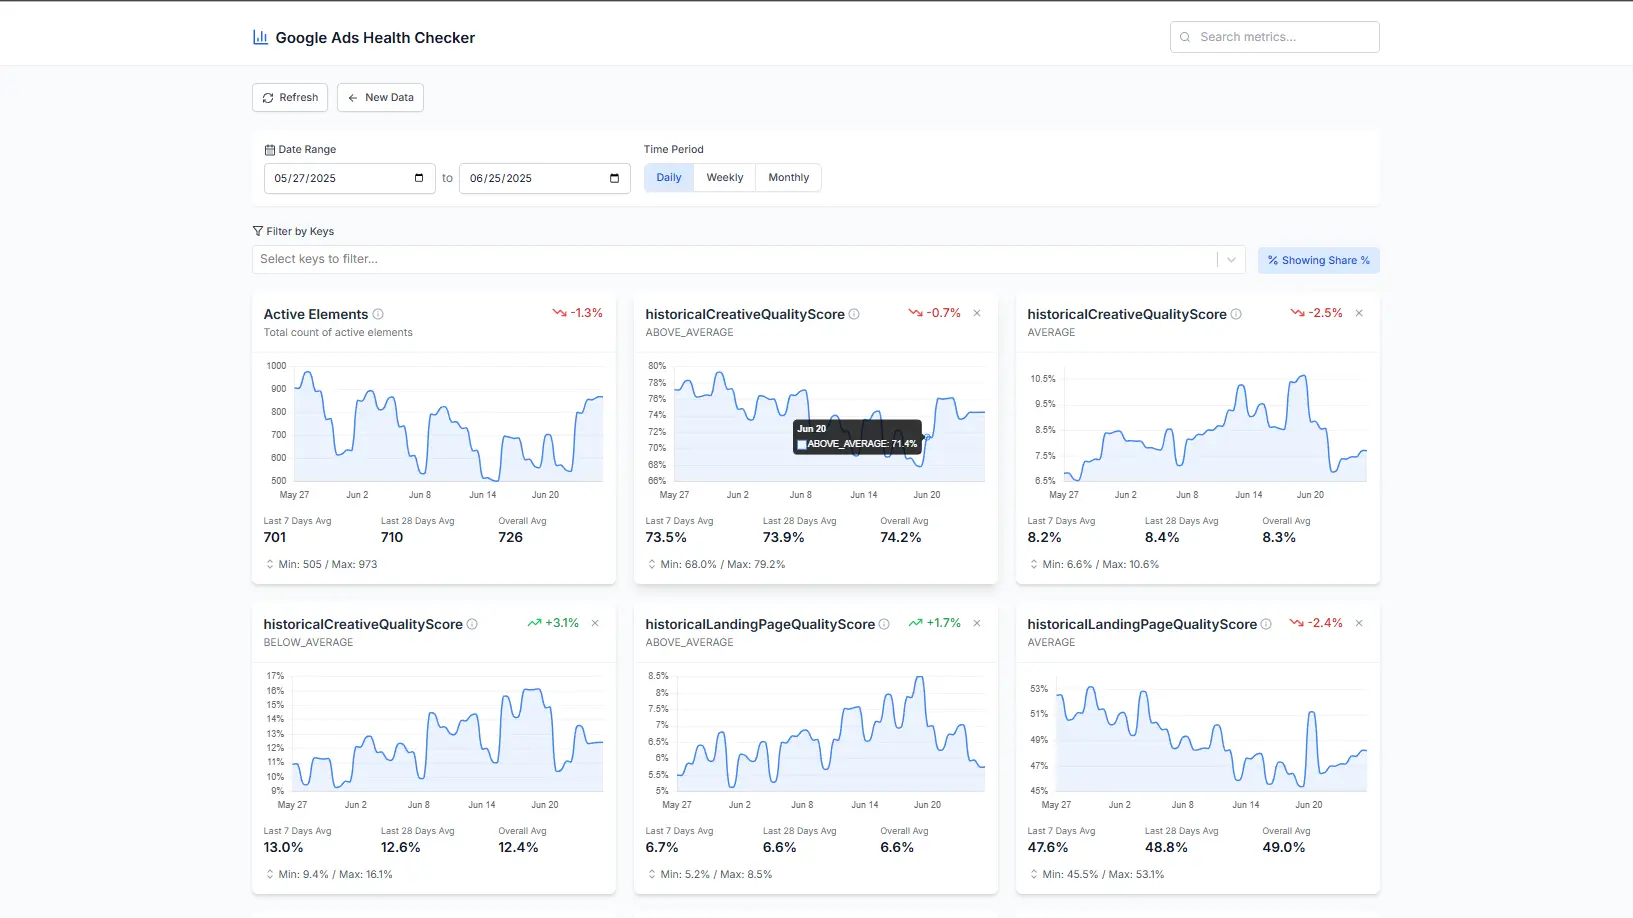
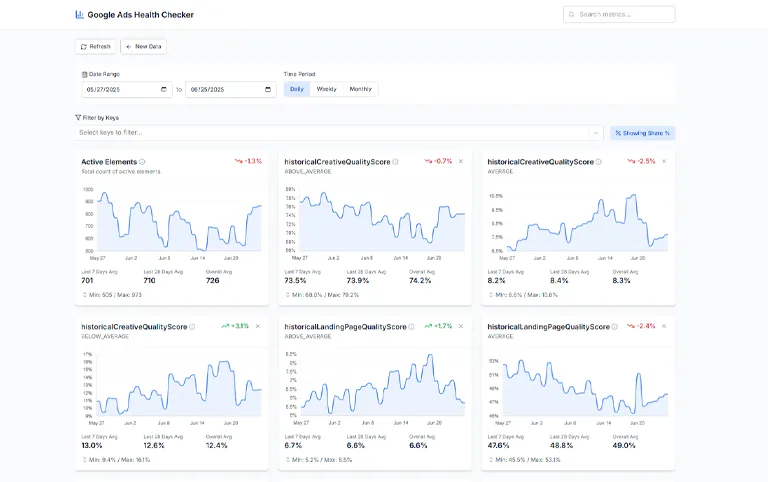
3) Get Visual Insights Instantly
Instantly see how your LPQS and other sub-metrics evolve over time, with flexible daily, weekly, or monthly views.
Google Ads Script to Export Your Quality Score Metrics
Here’s the full Google Apps Script you’ll need. This script goes through each sub-account in your MCC, queries Google Ads for keyword-level metrics like LPQS, Expected CTR, and Ad Relevance, then writes a summarized daily report into your connected Google Sheet.
Need step-by-step setup instructions? Check out our full guide here.
					/**
 * Ads Health Checker Script — PEMAVOR
 *
 * Author: Stefan Neefischer
 * Role: Co-Founder, Innovation & Strategy, PEMAVOR
 * Contact: info@pemavor.com
 * Hosted Tool: https://adshealthchecker.pemavor.com
 *
 * This script loops through all child accounts under your MCC,
 * pulls historical Quality Score sub-metrics (including Landing Page QS)
 * from Google Ads' keyword_view, aggregates counts by date, and writes
 * the results into a Google Sheet for easy visualization.
 **/

// ---------------------------------
// CONFIGURATION
// ---------------------------------

// 1) Replace with your Google Sheet ID (string between /d/ and /edit in the sheet URL).
const SPREADSHEET_ID = 'SPREADSHEET_ID'; // <<< IMPORTANT: Update this line!

// 2) Time window (in days) for historical data. 365 = one year of daily values.
const TIME_WINDOW = 365;

// 3) List of QS fields to retrieve. Add or remove fields as needed.
const SELECTED_FIELDS = [
  'metrics.historical_quality_score',
  'metrics.historical_creative_quality_score',
  'metrics.historical_landing_page_quality_score',
  'metrics.historical_search_predicted_ctr'
];

// Helper: Convert snake_case to camelCase
function snakeToCamel(s) {
  return s.replace(/_([a-z])/g, (g) => g[1].toUpperCase());
}

// Map: snake_case field → camelCase field
const FIELD_CAMELCASE_MAP = Object.fromEntries(
  SELECTED_FIELDS.map(f => [f, f.replace(/\.([a-z_]+)/g, (m, p1) => '.' + snakeToCamel(p1))])
);
// Example: 'metrics.historical_quality_score' → 'metrics.historicalQualityScore'

/**
 * MAIN FUNCTION
 * • Iterates through each sub-account in your MCC.
 * • Queries keyword_view for QS sub-metrics over the last TIME_WINDOW days.
 * • Aggregates daily counts for each QS category (e.g., BELOW_AVERAGE).
 * • Writes a summary table into the specified Google Sheet.
 */
function main() {
  // 1. Compute date range: from (today – TIME_WINDOW) to (today – 1).
  const today = new Date();
  today.setDate(today.getDate() - 1);   // Yesterday
  const startDate = new Date(today);
  startDate.setDate(today.getDate() - TIME_WINDOW + 1);

  const tz = AdsApp.currentAccount().getTimeZone();
  const dateFormat = 'yyyy-MM-dd';
  const startDateStr = Utilities.formatDate(startDate, tz, dateFormat);
  const endDateStr   = Utilities.formatDate(today, tz, dateFormat);

  Logger.log(`📅 Processing date range: ${startDateStr} → ${endDateStr}`);

  // 2. Container to accumulate daily QS category counts across all accounts.
  const summary = {};
  let accountsProcessed = 0;

  const accountIterator = MccApp.accounts().get();
  const totalAccounts = accountIterator.totalNumEntities();

  // 3. Loop through each sub-account under the MCC.
  while (accountIterator.hasNext()) {
    const account = accountIterator.next();
    MccApp.select(account);
    accountsProcessed++;
    Logger.log(`▶ Processing account ${accountsProcessed}/${totalAccounts} (ID: ${account.getCustomerId()})`);

    // 4. Build the GAQL query for keyword-level QS metrics over the defined date range.
    const query = `
      SELECT
        ad_group_criterion.keyword.text,
        segments.date,
        ${SELECTED_FIELDS.join(', ')}
      FROM keyword_view
      WHERE
        segments.date BETWEEN '${startDateStr}' AND '${endDateStr}'
        AND metrics.impressions >= 0
        AND campaign.advertising_channel_type = 'SEARCH'
    `;

    // 5. Run the query and process results.
    const rows = AdsApp.search(query);
    let rowCount = 0;

    while (rows.hasNext()) {
      const row = rows.next();
      const flatRow = flattenObject(row);
      const date = flatRow['segments.date'];
      if (!date) continue;

      // Initialize daily summary if needed.
      if (!summary[date]) {
        summary[date] = { activeElements: 0 };
      }

      summary[date].activeElements++;
      const daySummary = summary[date];

      // 6. Tally each QS category into daySummary, e.g.:
      //    metrics.historicalLandingPageQualityScore_BELOW_AVERAGE
      for (const [key, value] of Object.entries(flatRow)) {
        if (key === 'segments.date') continue;
        // Use camelCase field names for matching
        if (!Object.values(FIELD_CAMELCASE_MAP).some(field => key.startsWith(field))) continue;

        if (Array.isArray(value)) {
          // Some fields (like primary_status_reasons) are arrays; iterate through each element.
          value.forEach(v => {
            const columnKey = `${key}_${v}`;
            daySummary[columnKey] = (daySummary[columnKey] || 0) + 1;
          });
        } else {
          const columnKey = `${key}_${value}`;
          daySummary[columnKey] = (daySummary[columnKey] || 0) + 1;
        }
      }

      rowCount++;
    }

    Logger.log(`    ✔ Rows processed: ${rowCount}`);
    if (accountsProcessed % 5 === 0 || accountsProcessed === totalAccounts) {
      Logger.log(`--- Completed ${accountsProcessed}/${totalAccounts} accounts ---`);
    }
  }

  // 7. Build header row dynamically, based on all observed summary keys.
  const headersSet = new Set();
  for (const date in summary) {
    Object.keys(summary[date]).forEach(key => headersSet.add(key));
  }
  const headers = ['activeElements', ...Array.from(headersSet).filter(h => h !== 'activeElements').sort()];

  // 8. Write data into the Google Sheet.
  const sheet = SpreadsheetApp.openById(SPREADSHEET_ID).getActiveSheet();
  sheet.clear();  // Clear any existing data
  sheet.appendRow(['Date', ...headers]);

  Object.keys(summary).sort().forEach(date => {
    const counts = headers.map(key => summary[date][key] || 0);
    sheet.appendRow([date, ...counts]);
  });

  Logger.log(`\n✅ Completed processing ${accountsProcessed} accounts.`);
  Logger.log('📄 Data written to Google Sheet successfully.');
}

/**
 * Recursively flattens a nested AdsApp row object into a dot-notated key→value map.
 * Example: { segments: { date: '2025-02-10' }, metrics: { ... } }
 * → { 'segments.date': '2025-02-10', 'metrics.metricName': value, ... }
 */
function flattenObject(obj, prefix = '') {
  const result = {};
  for (const key in obj) {
    if (!obj.hasOwnProperty(key)) continue;
    const val = obj[key];
    const fullKey = prefix ? `${prefix}.${key}` : key;

    if (val !== null && typeof val === 'object' && !Array.isArray(val)) {
      Object.assign(result, flattenObject(val, fullKey));
    } else {
      result[fullKey] = val;
    }
  }
  return result;
}
Why Use Google Ads Health Checker?
Whether you’re a PPC agency managing campaigns for clients or optimizing in-house accounts, you don’t need another spreadsheet. You need insight.
Here’s how this tool helps you:
Audit quality visually
Instead of digging through raw tables, you get microcharts that show trend lines, averages, and deviations. It’s built for PPC professionals who want quick answers with client-ready visuals.
Catch LPQS drops early
Daily tracking lets you detect landing page quality drops as soon as they happen. Fix navigation or content issues before they drive up CPCs or tank your ad rank.
Spot system-wide anomalies
Are multiple accounts showing a drop in Expected CTR or LPQS at the same time? That could indicate a larger issue, platform shifts, ad fatigue, or misalignment with Google’s latest quality model.
Isolate root causes faster
Zoom into any timeframe and compare across QS signals. See if performance issues tie back to ad copy changes, layout shifts, or other updates.
Why We Introduced the Google Ads Health Checker
If you’ve ever tried monitoring Quality Score trends across multiple Google Ads accounts, you know the frustration. There’s no native dashboard, no timeline view, and no way to see how things like Landing Page Quality Score or Expected CTR are evolving day to day.
Instead, you’re left squinting at spreadsheets when what you really need is signal clarity.
We built this tool because PPC professionals need clarity:
- Because LPQS volatility is real: Especially after Google’s Feb 2025 update, even minor navigation changes can cause sudden LPQS drops. By the time you notice in performance reports, it’s often too late. This tool makes those changes obvious, fast.
- Because detecting systemic issues shouldn’t take a forensic audit: When Expected CTR dips across multiple accounts, is it bad creative, broken pages, or Google moving the goalposts again? Our visualization highlights those shifts in seconds.
- Because your time shouldn’t be wasted on formatting CSVs: You export. You paste. We handle the rest. The tool is meant to be frictionless, so you spend more time optimizing, less time guessing.
Whether you’re troubleshooting one campaign or managing dozens of client accounts, this tool gives you a clear, reliable view into your ads’ health, exactly what Google doesn’t show you.
What You Can Track
Daily Landing Page Quality Score distribution
Historical trends for Ad Relevance and Expected CTR
Account-level CTR health
Active keyword elements over time
Category-level breakdowns (Below Avg / Avg / Above Avg)
Built for Scale
Designed to support account managers working across 5 or 500 accounts:
Scalable: Works across all accounts in your MCC
No setup headaches: No login, no OAuth, no code edits
Fast to onboard: Export → paste → visualize
A Smarter Way to Monitor Google Ads Quality Scores
The Google Ads Health Checker gives PPC pros a streamlined way to track Landing Page Quality Score, Expected CTR, and Ad Relevance over time. With daily visualization and zero setup friction, you’ll spot issues earlier, reduce wasted spend, and make smarter optimization decisions.
Ready to take control of your Quality Score metrics? Try the Google Ads Health Checker today!
Need Advanced Solutions?
Our free tool reveals Quality Score trends, but deeper issues often require a full account audit. We offer advanced audits to uncover structural gaps, performance anomalies, and missed opportunities, tailored to your unique campaign setup.
Let’s audit your account and boost your ad performance.